Infographic Tools
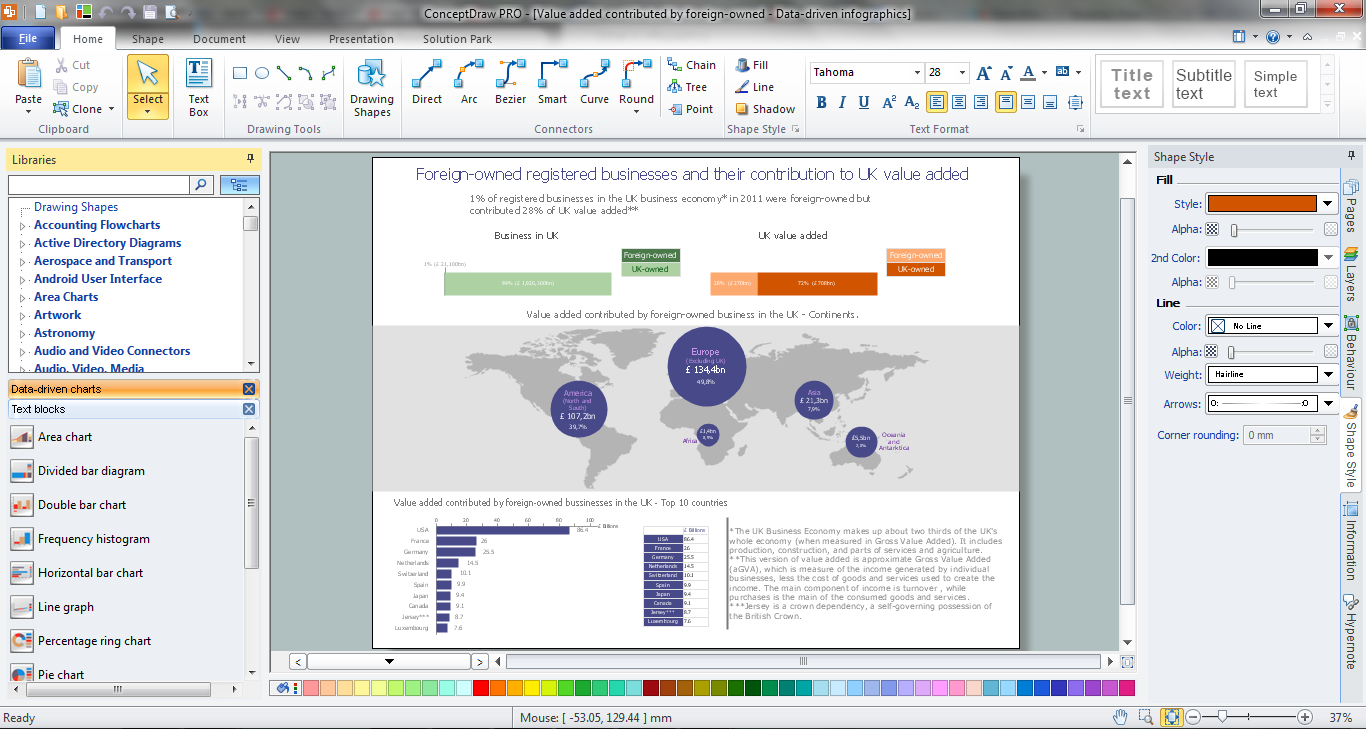
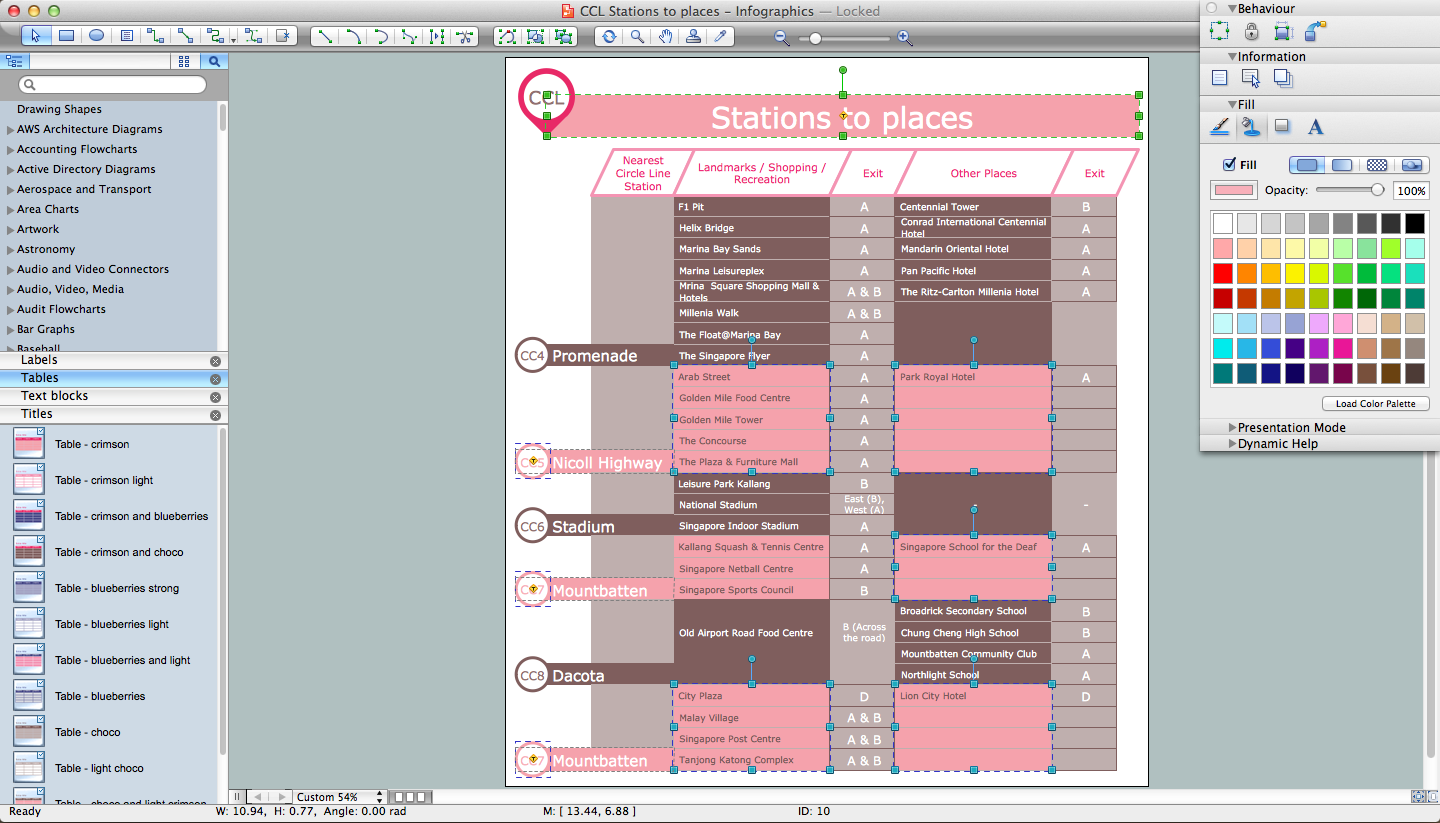
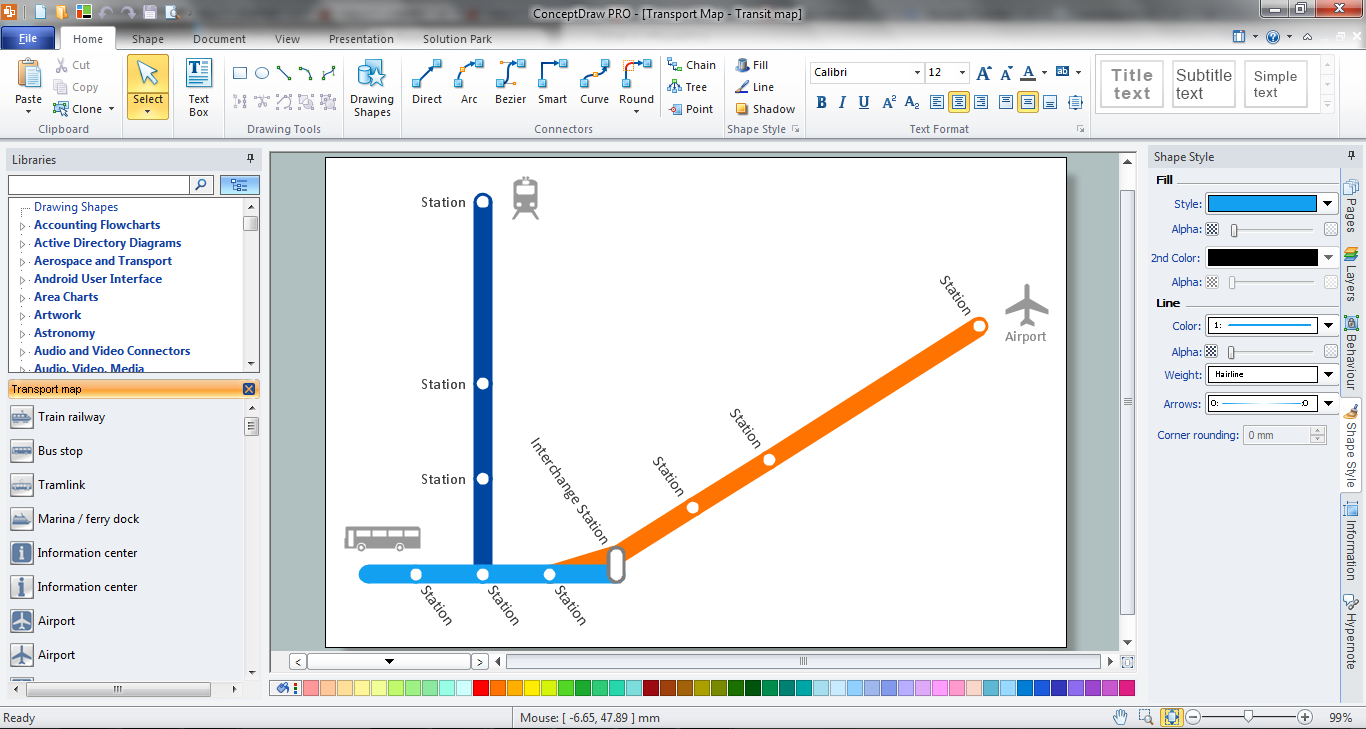
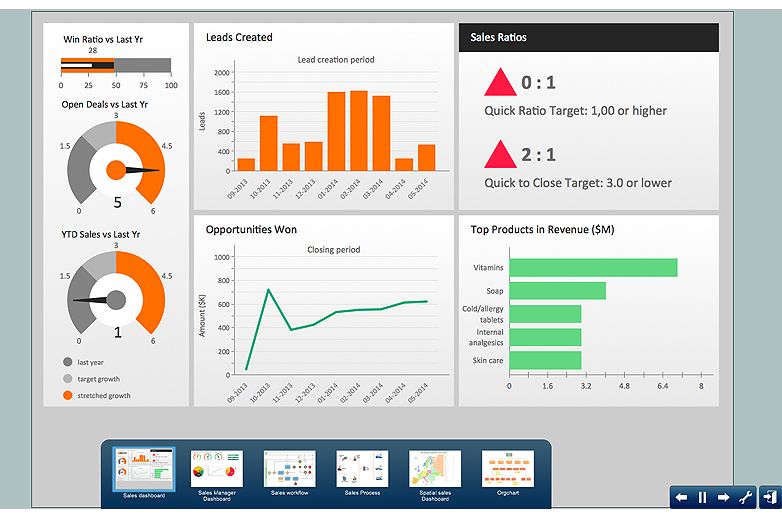
ConceptDraw PRO diagramming and vector drawing software offers the best infographic tools - Data-driven Infographics Solution from the “What are Infographics” Area of ConceptDraw Solution Park.
 ConceptDraw Solution Park
ConceptDraw Solution Park collects graphic extensions, examples and learning materials
Best Tool for Infographic Construction
ConceptDraw is a best data visualization tool that will allow everyone to create rich infographics and visualizations quickly and easily.Infographic Maker
Infographic is a visual way of representing various information, data, knowledge in statistics, geography, journalism, education, and much more areas. ConceptDraw PRO supplied with Pictorial Infographics Solution from the “What are Infographics” Area, provides a set of powerful pictorial infographics tools. Thanks to them it is the best Infographic Maker.
 What are Infographic Area
Solutions of the area What is Infographics from ConceptDraw Solution Park collect templates, samples and vector stencils libraries with design elements for the drawing information graphics.
Typography Infographic Software
ConceptDraw PRO supplied with Typography Infographics Solution from the “What are Infographics” Area is a powerful typography infographic software that provides a set of useful typography infographics tools.Use the Typography Infographics Solution for ConceptDraw PRO typography infographic software to create your own professional looking Typography Infographics of any complexity quick, easy and effective, and then successfully use them in various fields.
Design Pictorial Infographics. Design Infographics
In the course of recent decades data visualization went through significant development and has become an indispensable tool of journalism, business intelligence and science. The way visual information may be conveyed is not limited simply to static or dynamic representation, it can also be interactive. Infographics can be conditionally divided into several general levels. Primarily, this is level of visualization of information, its interpretation and association on any ground. Second level can be defined as a visualization of knowledge, depiction of thoughts and ideas in the form of images or diagrams. Finally, the level of data visualization, which processes data arrays in charts, enabling the information to be more clearly perceived. You can also identify the main approaches to the creation of infographics: exploratory and narrative. Exploratory method insists on minimalist design in favor of data precision without unnecessary details and is common for scientific researches and anaHow to Draw Pictorial Chart. How to Use Infograms
How to draw pictorial chart quick, easy and effective? ConceptDraw PRO offers the unique Pictorial Infographics Solution that will help you!Pictorial Infographics solution contains large number of libraries with variety of predesigned vector pictograms that allows you design infographics in minutes. There are available 10 libraries with 197 vector pictograms.
Spatial Data Analysis
ConceptDraw PRO diagramming and vector drawing software extended with Pictorial Infographics Solution from the “What are Infographics” Area is the best for Spatial Data Analysis. You have a perfect possibility to make sure this right now.
 Business Productivity Area
Business Productivity Solutions extend ConceptDraw products with tools for making presentations, conducting meetings, preparing documents, brainstorming, or building new strategies.
 Project Management Area
Project Management area provides Toolbox solutions to support solving issues related to planning, tracking, milestones, events, resource usage, and other typical project management functions.
HelpDesk
How to Perform a Dynamic Presentation with ConceptDraw PRO
Every ConceptDraw PRO document can be viewed as a presentation. Dynamic Presentation option enables you to make an interactive on-line presentation of ConceptDraw PRO documents. You can edit documents during the Dynamic presentation directly, add notes and feedback making it accurate and up to date in a moment. ConceptDraw PRO allows you to save presentation as a slide show that opens immediately in a full-screen. Any ConceptDraw presentation can be performed in three ways; manually, automatic slide-show, and cyclic-playing mode.
 Universal Diagramming Area
This area collects solutions for drawing diagrams, charts, graphs, matrices, geographic and road maps for education, science, engineering, business.
- Tools to Create Your Own Infographics | Best Flowchart Software ...
- Metro Map | Best Value Stream Mapping mac Software | Subway ...
- Map Infographic Creator | Best Tool for Infographic Construction ...
- Best Value Stream Mapping mac Software | Subway infographic ...
- Best Tool for Infographic Construction | Map Infographic Creator ...
- Map Infographic Creator | Best Tool for Infographic Construction ...
- Map Infographic Creator | How to draw Metro Map style infographics ...
- Infographic design elements, software tools Subway and Metro style ...
- Best Tool for Infographic Construction
- Best Value Stream Mapping mac Software
- Best Tool for Infographic Construction | How to Create a Powerful ...
- How to draw Metro Map style infographics ? (London) | Infographic ...
- Travel Infographics | How to draw Metro Map style infographics ...
- Directional Maps | Best Tool for Infographic Construction | Map ...
- Infographic software: the sample of New York City Subway map ...
- Infographic design elements, software tools Subway and Metro style ...
- Map Infographic Design | Spatial infographics Design Elements ...
- How to draw Metro Map style infographics ? (New York) | How to ...
- Infographic design elements, software tools Subway and Metro style ...
- Conceptdraw.com: Mind Map Software, Drawing Tools | Project ...


