ConceptDraw Arrows10 Technology
How should diagramming software work? Is it possible to develop a diagram as quickly as the ideas come to you? The innovative ConceptDraw Smart Connectors Technology - This is more than enough versatility to draw any type of diagram with any degree of complexity. Connection points are necessary for diagramming network, flowchart and organizational charts. In ConceptDraw you connect shapes by attaching, or snapping and gluing, connectors to shape connection points."A piping and instrumentation diagram/ drawing (P&ID) is a diagram in the process industry which shows the piping of the process flow together with the installed equipment and instrumentation. ...
P&IDs play a significant role in the maintenance and modification of the process that it describes. It is critical to demonstrate the physical sequence of equipment and systems, as well as how these systems connect. During the design stage, the diagram also provides the basis for the development of system control schemes, allowing for further safety and operational investigations, such as a Hazard Analysis and Operability Study...
For processing facilities, it is a pictorial representation of:
Key piping and instrument details,
Control and shutdown schemes,
Safety and regulatory requirements,
Basic start up and operational information." [Piping and instrumentation diagram. Wikipedia]
The piping and instrumentation diagram template for the ConceptDraw PRO diagramming and vector drawing software is included in the Chemical and Process Engineering solution from the Engineering area of ConceptDraw Solution Park.
 Chemical and Process Engineering
This chemical engineering solution extends ConceptDraw PRO v.9.5 (or later) with process flow diagram symbols, samples, process diagrams templates and libraries of design elements for creating process and instrumentation diagrams, block flow diagrams (BFD
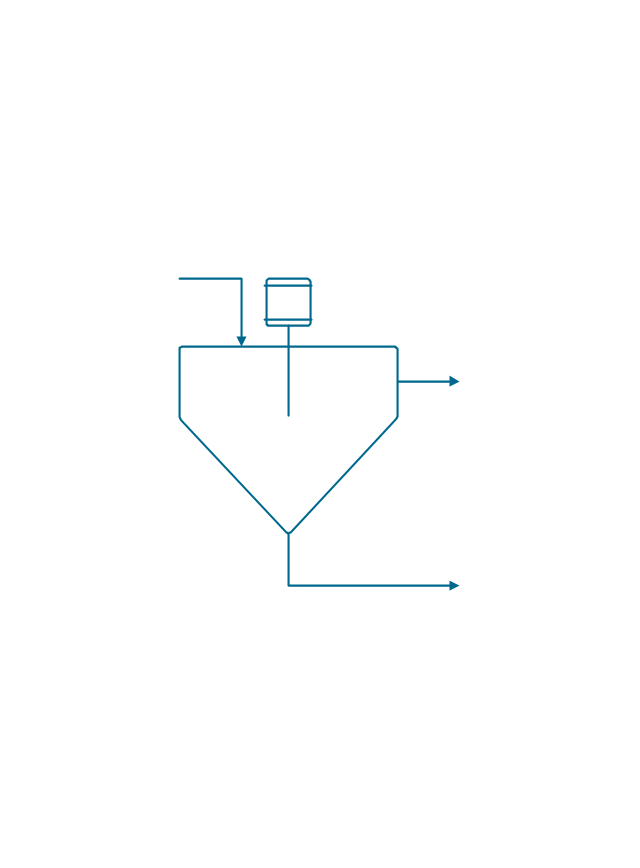
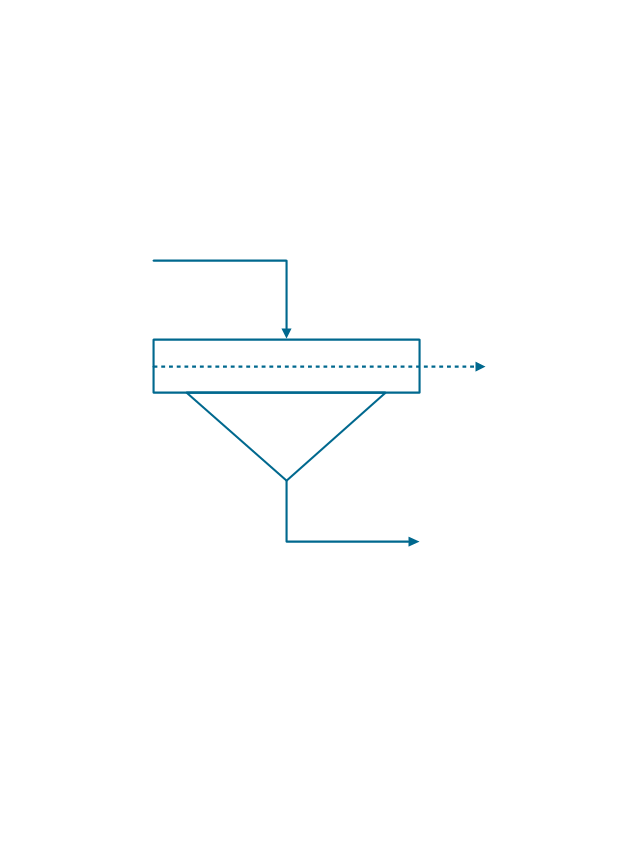
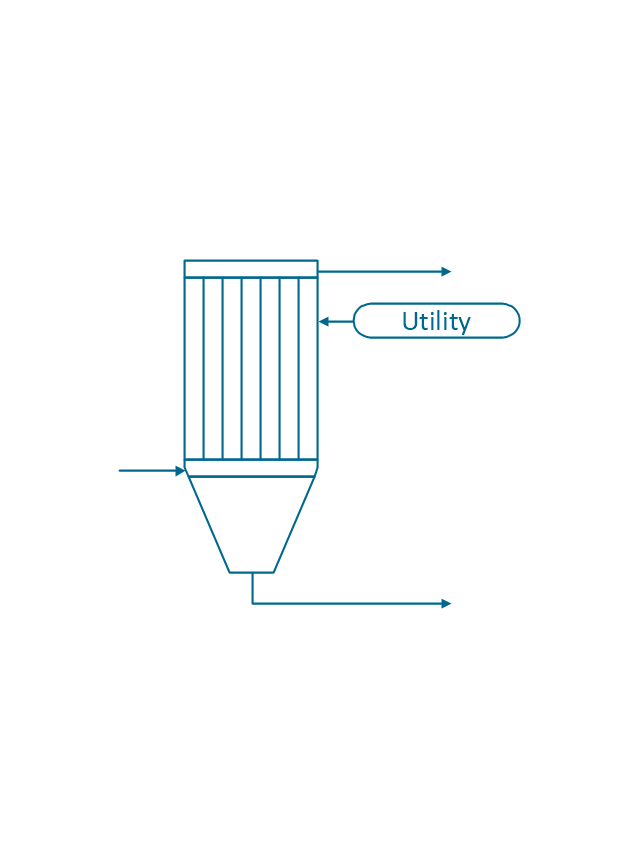
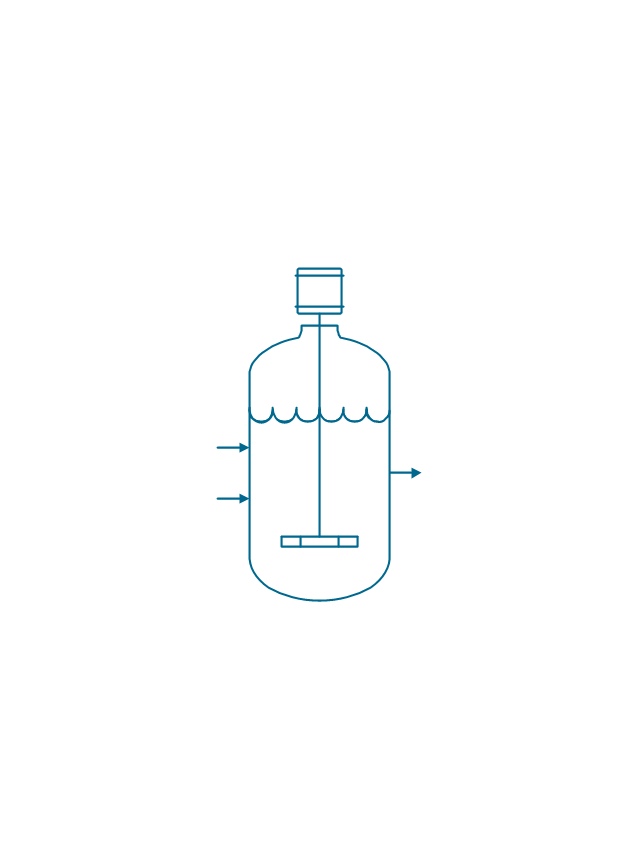
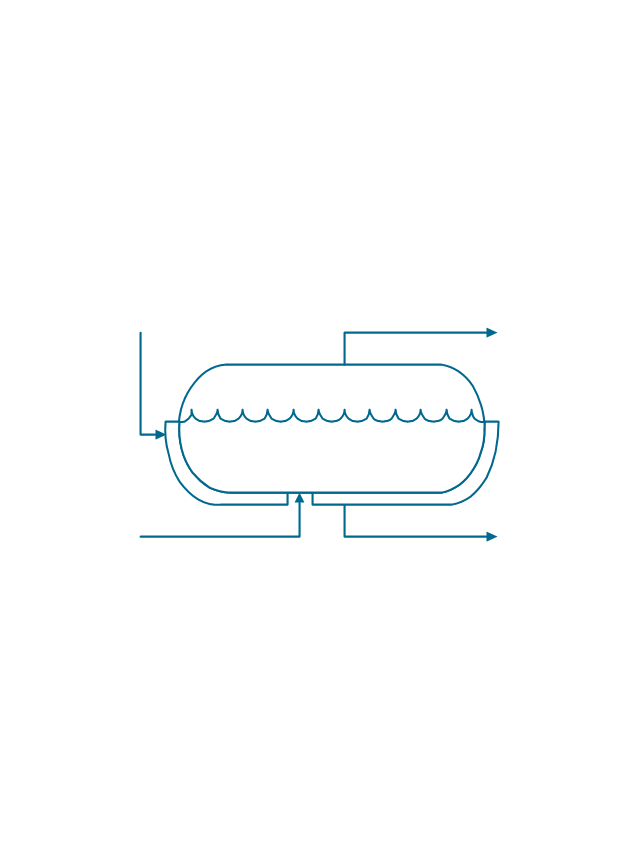
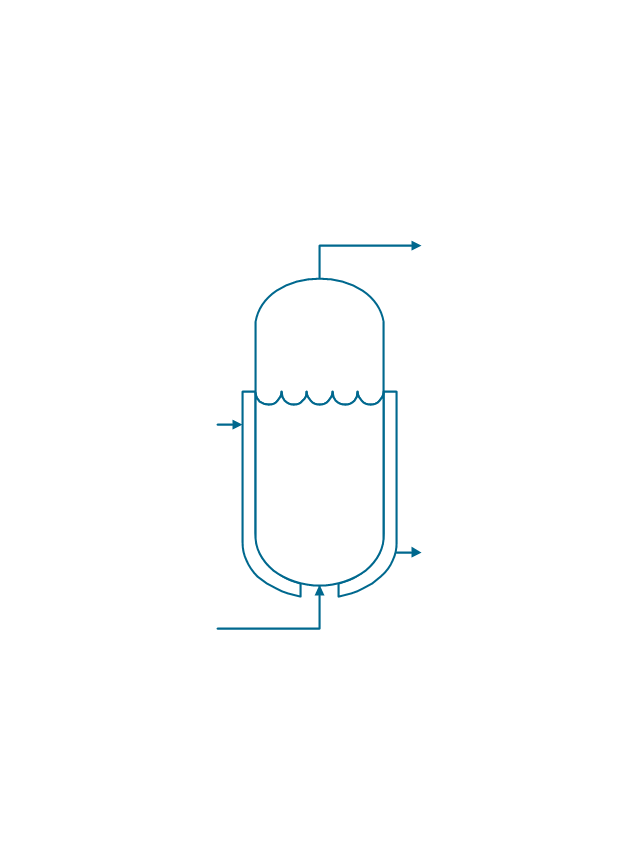
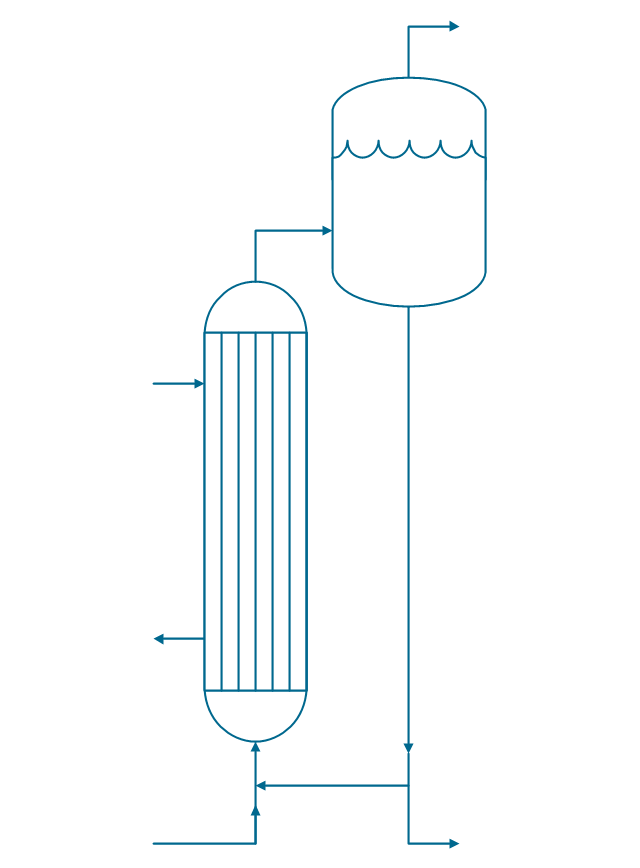
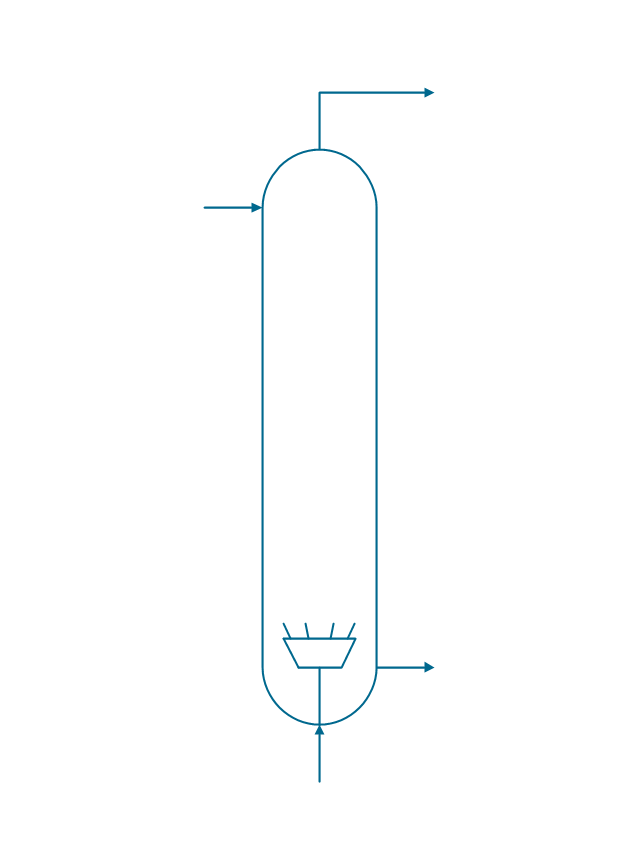
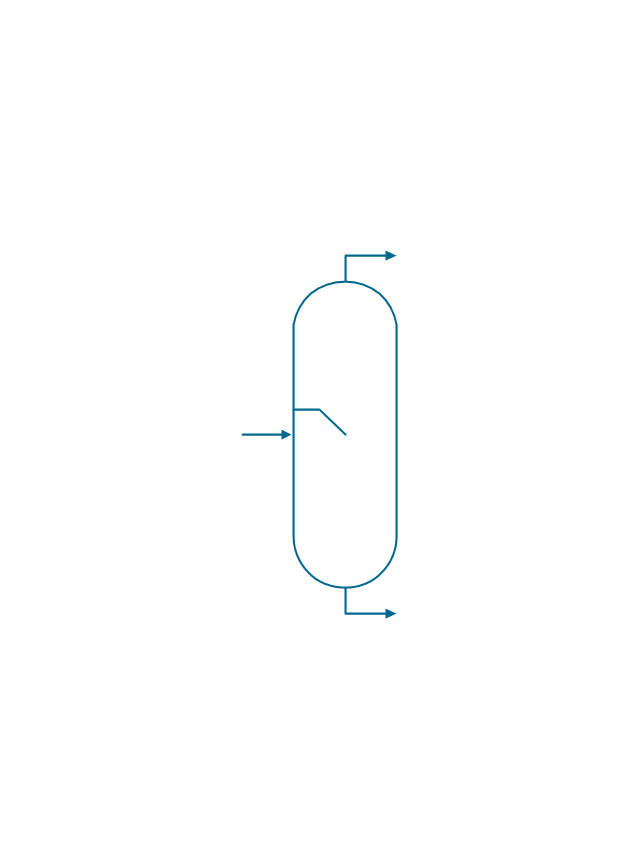
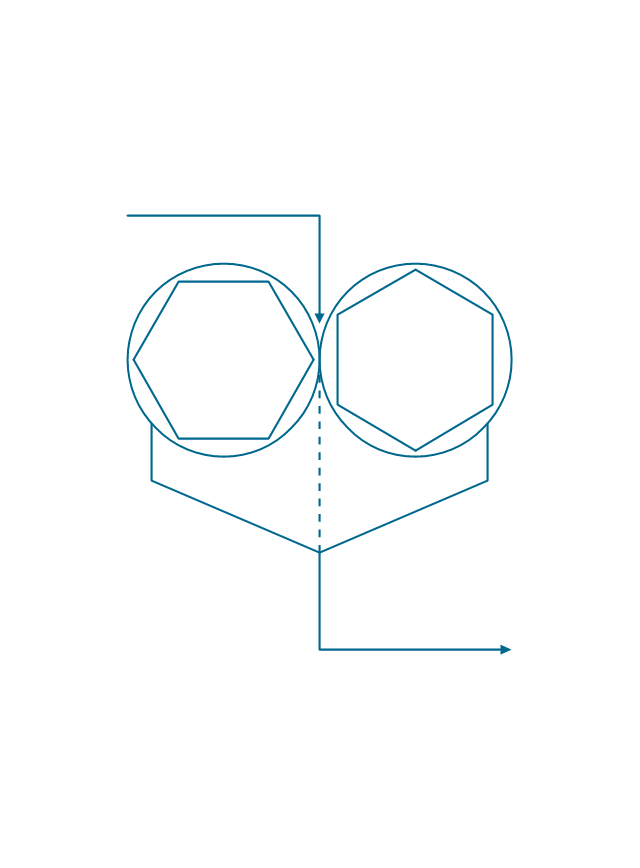
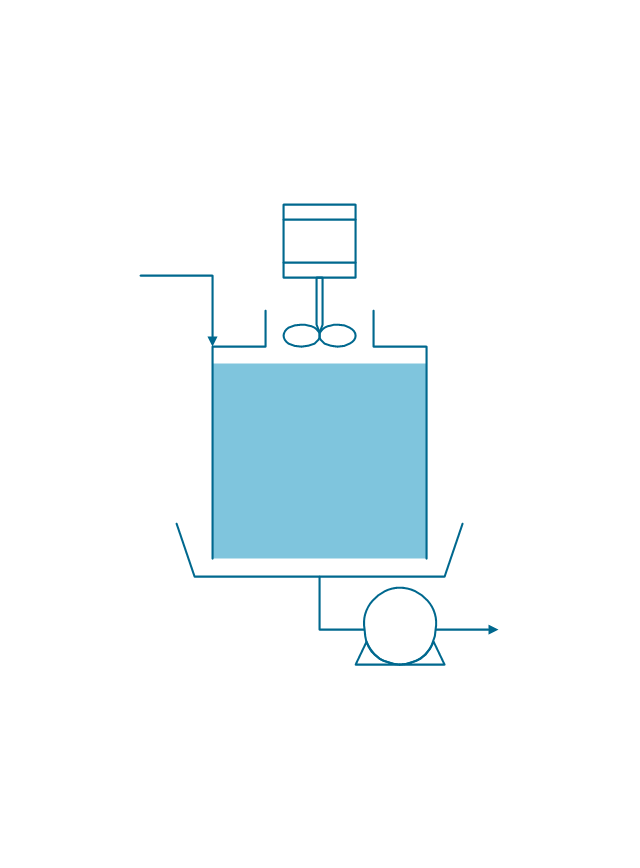
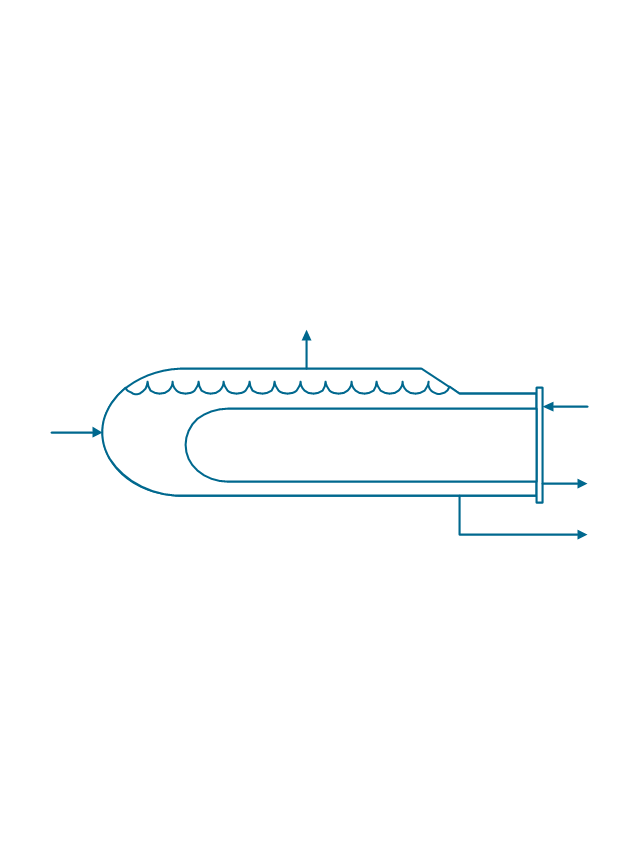
The vector stencils library "Chemical engineering" contains 24 symbols of chemical and process engineering equipment.
Use these shapes for drawing Process Flow Diagrams (PFD), Piping and Instrumentation Diagrams (P&ID), and Water Flow Diagrams in the ConceptDraw PRO software extended with the Chemical and Process Engineering solution from the Chemical and Process Engineering area of ConceptDraw Solution Park.
www.conceptdraw.com/ solution-park/ engineering-chemical-process
This vector stencils library contains 22 symbols of process annotations for setting automatic labels to display a datasheet field for a pipeline shape, labels, captions, outlines, off-sheet labels, text balloons, annotations, outlines, tags, and descriptions.
Use these shapes for drawing Process Flow Diagrams (PFD) and Piping and Instrumentation Diagrams (P&ID) in the ConceptDraw PRO software extended with the Chemical and Process Engineering solution from the Chemical and Process Engineering area of ConceptDraw Solution Park.
www.conceptdraw.com/ solution-park/ engineering-chemical-process
The vector stencils library "Chemical engineering" contains 24 symbols of chemical and process engineering equipment.
Use these shapes for drawing block flow diagrams (BFD), process flow diagrams (PFD), piping and instrumentation diagrams (P&ID), and water flow diagrams.
"Chemical engineering is a branch of engineering that applies the natural (or experimental) sciences (e.g., chemistry and physics) and life sciences (e.g. biology, microbiology and biochemistry) together with mathematics and economics to production, transformation, transportation and proper usage of chemicals, materials and energy. It essentially deals with the engineering of chemicals, energy and the processes that create and/ or convert them. Modern chemical engineers are concerned with processes that convert raw-materials or (cheap)chemicals into more useful or valuable forms. In addition, they are also concerned with pioneering valuable materials and related techniques – which are often essential to related fields such as nanotechnology, fuel cells and bioengineering. Within chemical engineering, two broad subgroups include design, manufacture, and operation of plants and machinery in industrial chemical and related processes ("chemical process engineers") and development of new or adapted substances for products ranging from foods and beverages to cosmetics to cleaners to pharmaceutical ingredients, among many other products ("chemical product engineers")." [Chemical engineering. Wikipedia]
The example "Design elements - Chemical engineering" was created using the ConceptDraw PRO diagramming and vector drawing software extended with the Chemical and Process Engineering solution from the Engineering area of ConceptDraw Solution Park.
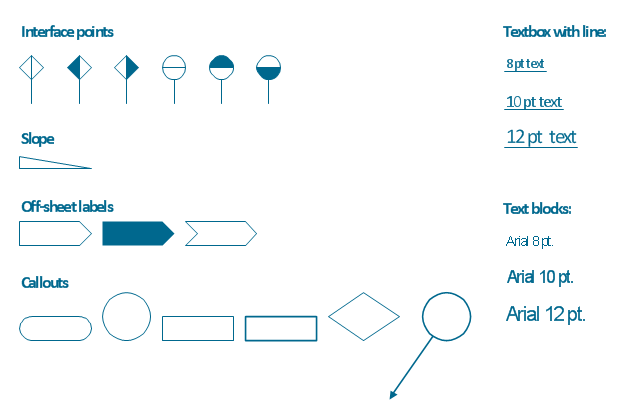
The vector stencils library "Process annotations" contains 22 symbols of interface points, slope, off-sheet labels, callouts and textboxes.
Use these shapes for setting automatic labels to display a datasheet field for a pipeline shape, labels, captions, outlines, off-sheet labels, text balloons, annotations, outlines, tags, and descriptions.
"In engineering a process is a set of interrelated tasks that, together, transform inputs into outputs. These tasks may be carried out by people, nature, or machines using resources; so an engineering process must be considered in the context of the agents carrying out the tasks, and the resource attributes involved. Systems Engineering normative documents and those related to Maturity Models are typically based on processes. For example, System Engineering processes of the EIA-632 and processes involved in the Capability Maturity Model Integration (CMMI) institutionalization and improvement approach. Constraints imposed on the tasks and resources required to implement them are essential for executing the tasks mentioned.
A chemical process is a series of unit operations used to produce a material in large quantities.
In the chemical industry, chemical engineers will use the following to define or illustrate a process:
Process Flow Diagram (PFD),
Piping and instrumentation diagram
(P&ID),
Simplified process description,
Detailed process description,
Project management,
Process simulation." [Process (engineering). Wikipedia]
The example "Design elements - Process annotations" was created using the ConceptDraw PRO diagramming and vector drawing software extended with the Chemical and Process Engineering solution from the Engineering area of ConceptDraw Solution Park.
- Piping and Instrumentation Diagram Software | Chemical Software ...
- Chemical engineering - Vector stencils library | Pid Diagram For ...
- Design Software Program For Chemical Engineers
- Piping and Instrumentation Diagram Software | Process Diagrams ...
- Piping and instrumentation diagram template | Piping and ...
- Chemical engineering - Vector stencils library | P Id Evaporator
- How to Draw a Chemical Process Flow Diagram
- Piping and Instrumentation Diagram Software
- Piping and Instrumentation Diagram Software | Process and ...
- Piping and Instrumentation Diagram Software | Chemical and ...
- Diagram Of System Software Program
- Diaphragm Pump Symbol P Id
- Technical Drawing Software | Piping and Instrumentation Diagram ...
- Process Flowchart | Process and Instrumentation Diagram | Piping ...
- Technical Drawing Software | Chemical Engineering | Process Flow ...
- Chemical Engineering Process Flow Diagram Software Free
- Piping and Instrumentation Diagram Software | Valves and fittings ...
- Process Flow Diagram Symbols | How to Draw a Chemical Process ...
- Chemical and Process Engineering | Chemical engineering - Vector ...

-piping-and-instrumentation-diagram-template.png--diagram-flowchart-example.png)











-process-annotations---vector-stencils-library.png--diagram-flowchart-example.png)
-process-annotations---vector-stencils-library.png--diagram-flowchart-example.png)

-process-annotations---vector-stencils-library.png--diagram-flowchart-example.png)
-process-annotations---vector-stencils-library.png--diagram-flowchart-example.png)


