Best Mind Mapping Program for Making Presentations
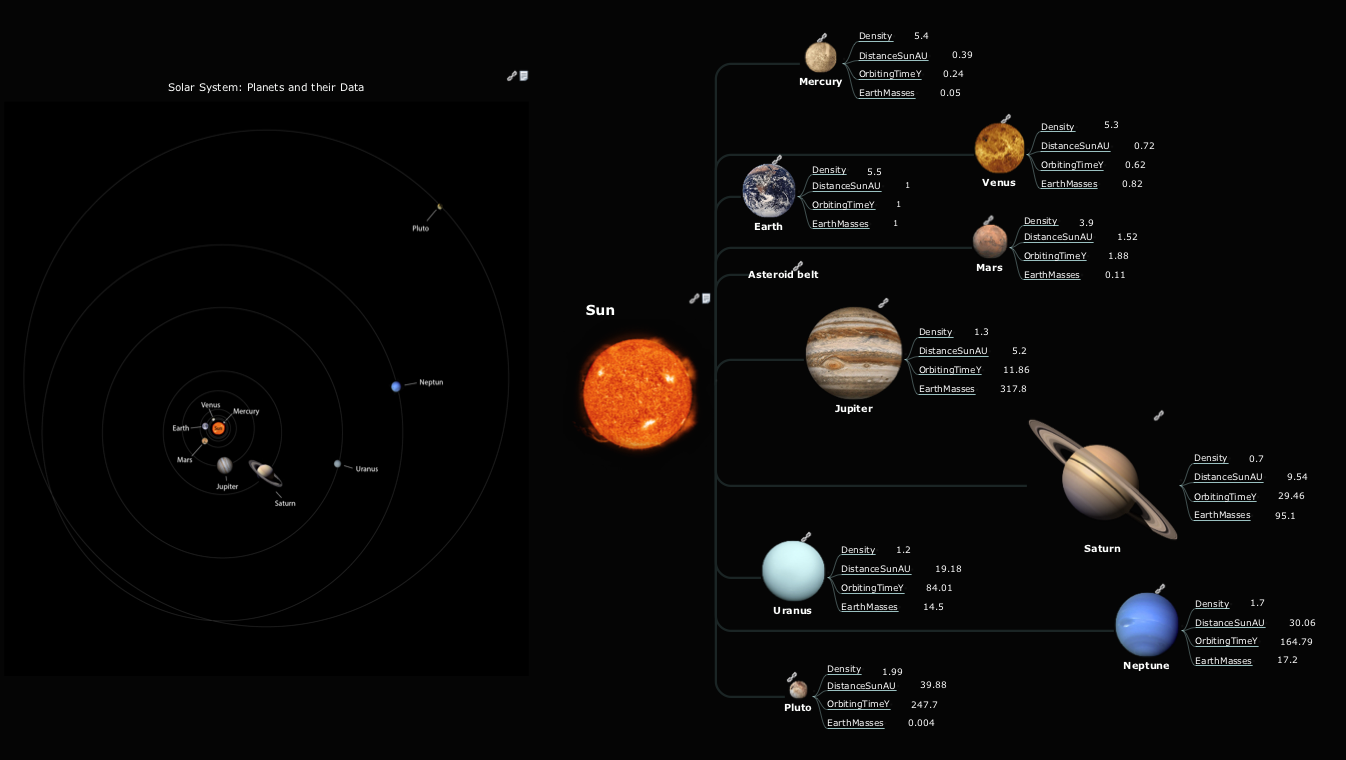
ConceptDraw MINDMAP with the ability to import presentations from Microsoft PowerPoint, as well as enhancing its existing presentation capabilities.Best Tool for Infographic Construction
ConceptDraw is a best data visualization tool that will allow everyone to create rich infographics and visualizations quickly and easily.Mind Map - Quality Structure
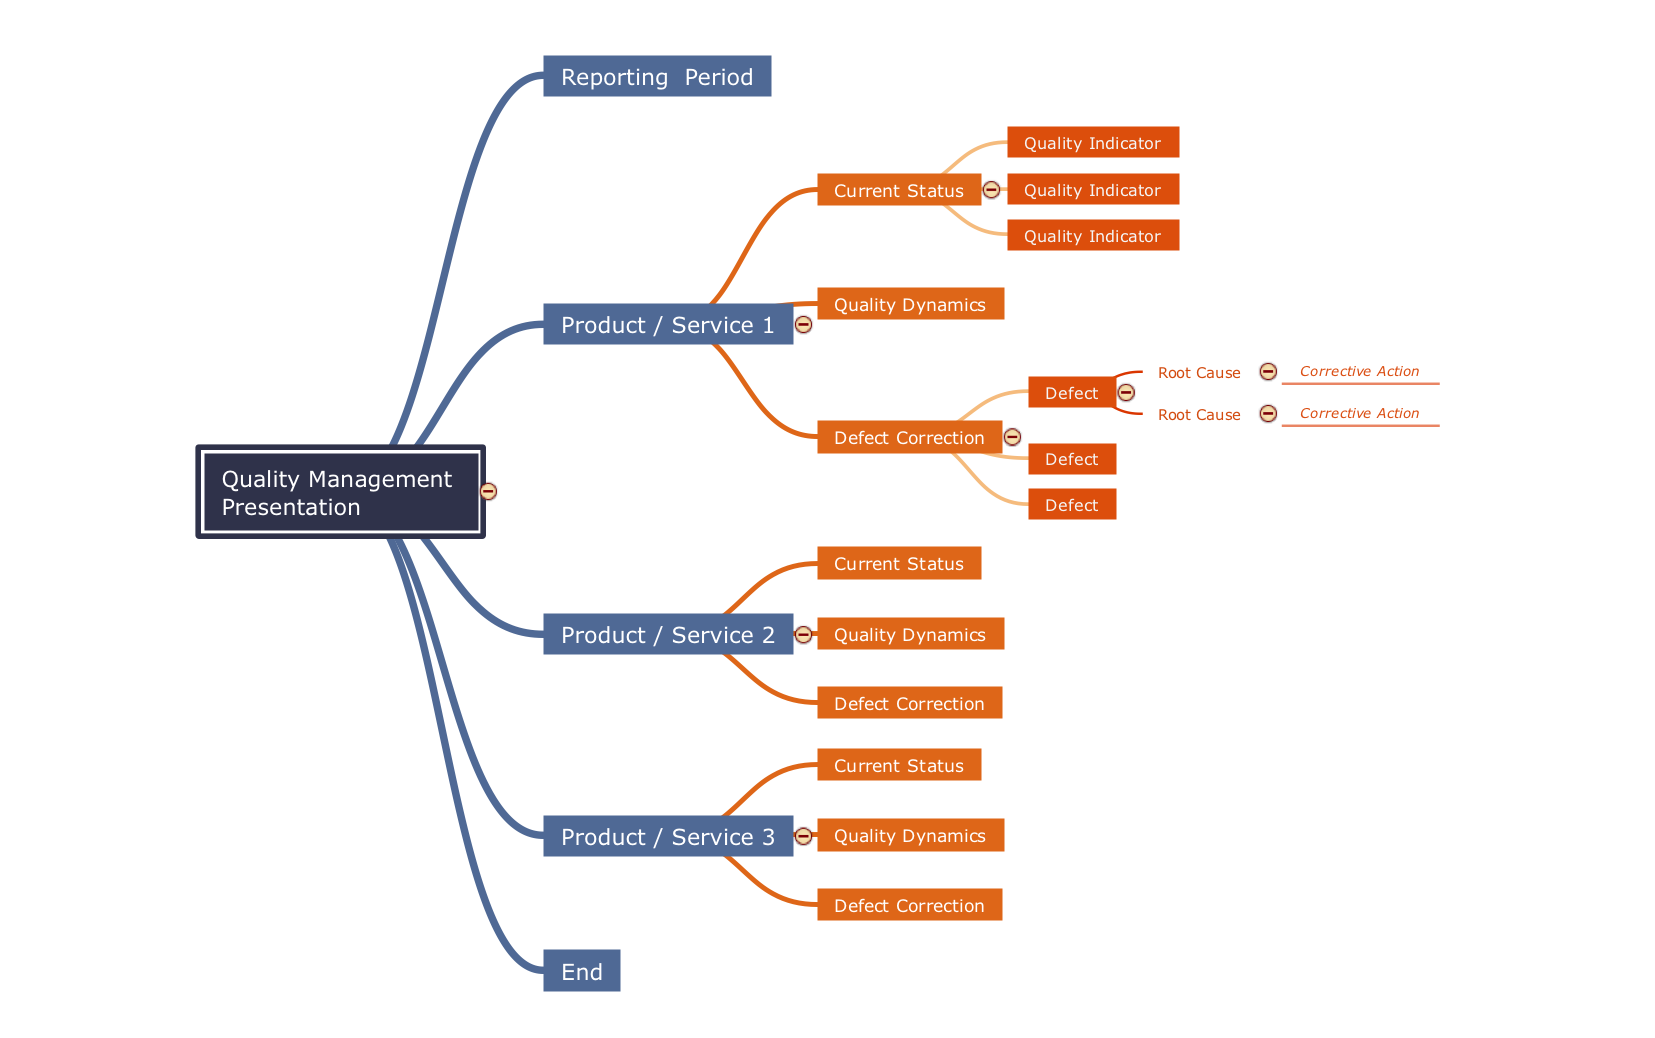
ConceptDraw MINDMAP is a good way to describe visual instructions on any quality process.Quality Improvement
Constant improvement of key performance indicators that are related to quality is a step in the right direction for a company interested in market growth.Best Software for Making Presentations
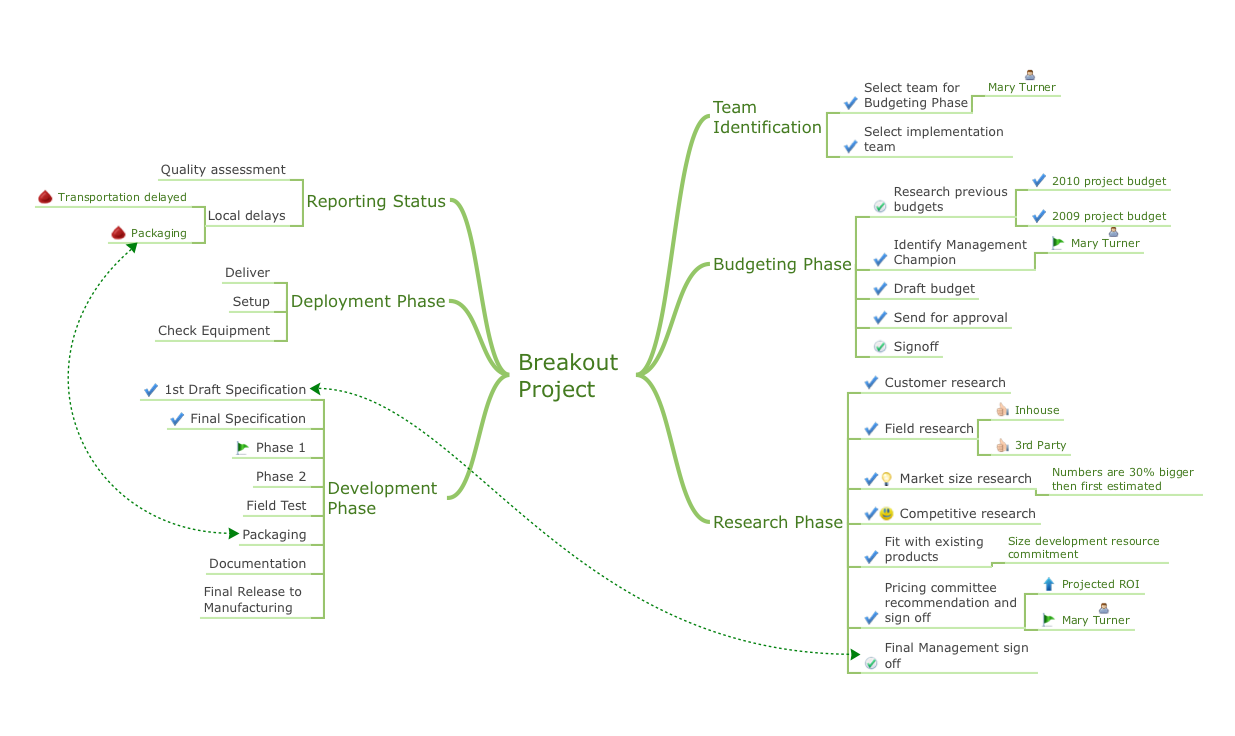
An advanced tool for creating presentations, if you decide to represent data without spending hours on that.Cross-Functional Flowchart (Swim Lanes)
Cross-Functional Flowchart is a type of chart which shows the series of process steps connected by the arrows to depict their order and applies the swim lanes to provide an extra dimension with means of assigning each process step to certain category. Often the category or the functional unit is a stakeholder (department, person, role), resource, project, phase, or any other attribute. Cross-Functional Flowcharts visually illustrate relationships between the business processes and the functional units responsible for this processes. ConceptDraw DIAGRAM is a powerful diagramming and vector drawing software for professional design Cross-Functional Flowcharts using the common notation of shapes and swim lanes. Cross-Functional Flowcharts solution included to the Business Processes area of ConceptDraw Solution Park provides numerous well-designed vector objects and connector tools for quick, easy and effective organizing information, representing process flows and relationships, and drawing Cross-Functional Flowcharts for business, science, education, technology, etc.Best Program to Make Diagrams
Make diagrams, charts, workflows, flowcharts, org charts, project charts easily with ConceptDraw software.
How to draw Metro Map style infographics? Moscow, New York, Los Angeles, London
The solution handles designs of any complexity, and the comprehensive library covers all key aspects of a transportation system. To further enhance your map design, there is the option to embed links, that can display station images or other relevant, important information. We have also included a set of samples in the solution, that show the possible real-world application — complex tube systems including the London Tube and New York City Subway show the level of detail possible when using the Metro Map Solution.The Best Mac Software for Diagramming or Drawing
ConceptDraw DIAGRAM is a powerful intelligent vector graphics engine that can be used to create basic diagrams including flowcharts, charts, workflows, flowcharts, organizational charts, business diagram, learn business diagrams, flow diagrams.
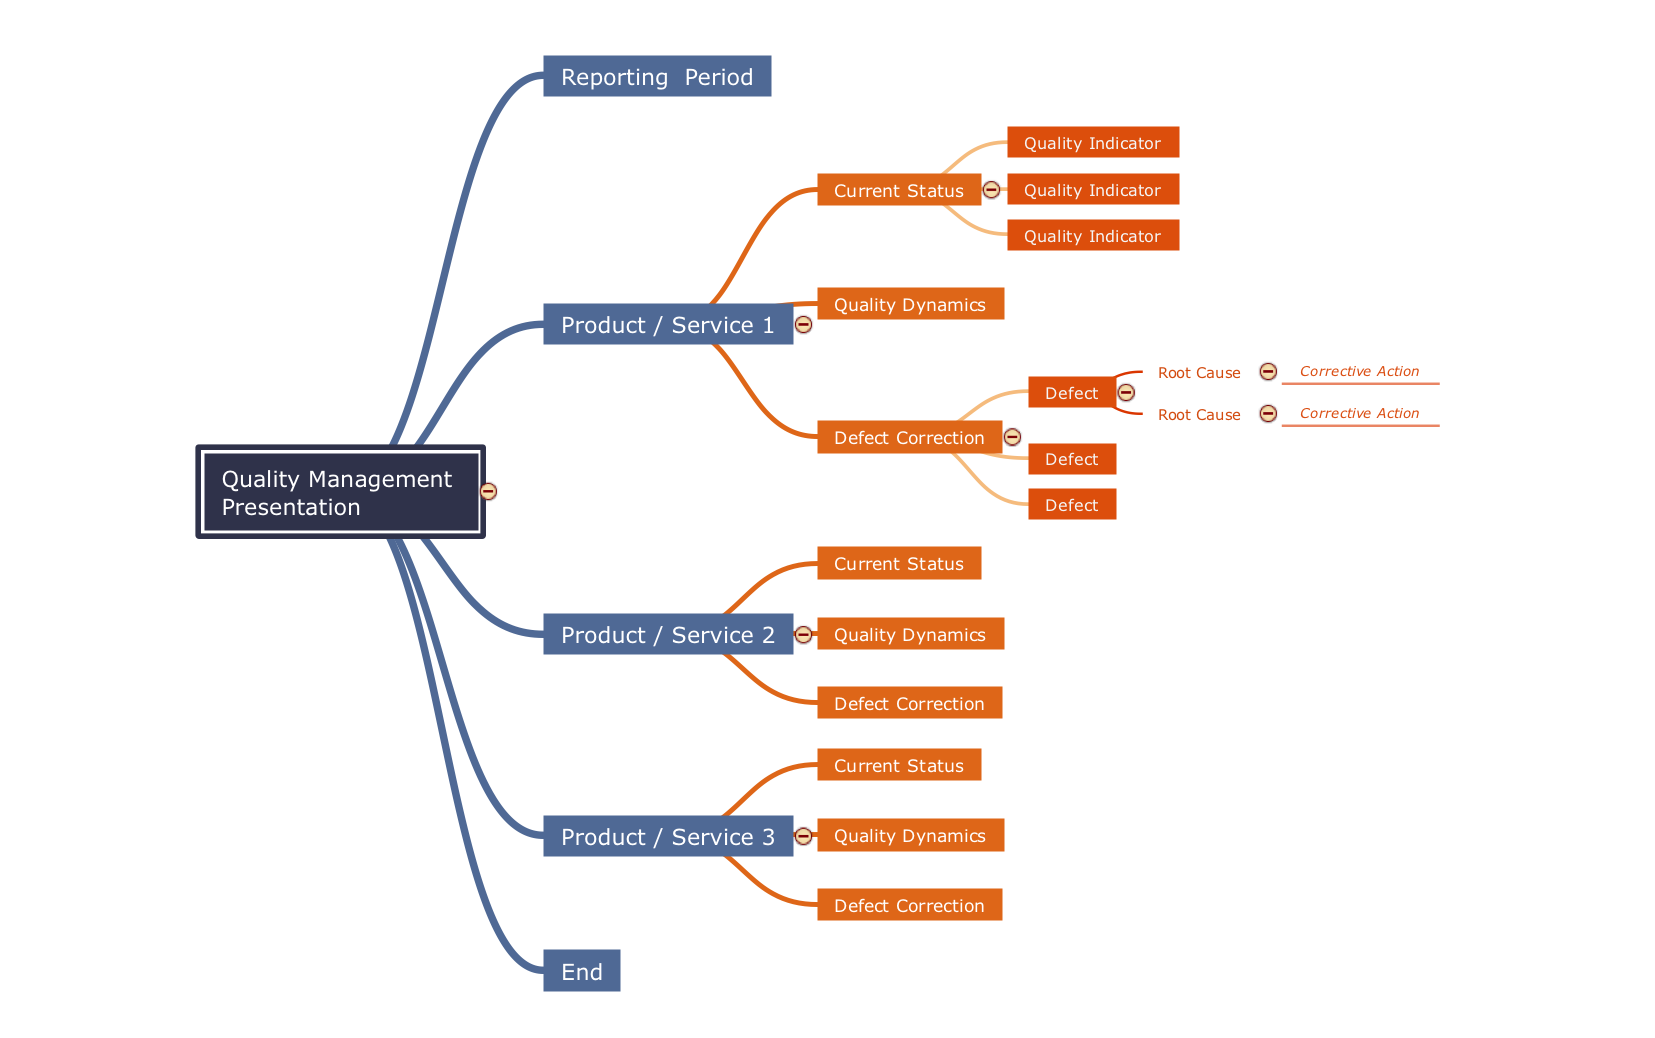
Fundamental Tool in Quality Management
ConceptDraw MINDMAP is a fundamental tool in quality management to describe visual instructions on any process.- How To Make a Concept Map | Concept Map Maker | Concept ...
- How To Make a Concept Map | How to Start Mind Mapping from a ...
- The Best Choice for Creating Diagram | The Best Flowchart Software ...
- Mind Map Best Program To Make An Organizational Chart
- Best Mind Mapping Program for Making Presentations | Mind Map ...
- Best Mind Mapping Program for Making Presentations | Best ...
- How To Make a Concept Map | The Best Flowchart Software ...
- How To Make a Concept Map | Quality Mind Map | Concept Map ...
- How To Create a Flow Chart in ConceptDraw | Best Mind Mapping ...
- Mind Map Making Software | Best Mind Mapping Program for ...


