Dashboard
ConceptDraw PRO extended with Sales Dashboard solution from the Marketing area of ConceptDraw Solution Park is a perfect software for creating the live dashboard for the business data and progress visualization.KPI Dashboard
ConceptDraw PRO diagramming and vector drawing software supplied with Sales Dashboard solution from the Marketing area of ConceptDraw Solution Park provides the full set of useful tools which make it the best for producing the live KPI Dashboard of any complexity.Sales Dashboard - Access Anywhere
ConceptDraw Sales Dashboard is an automatically updated sales dashboard you can customize to see KPI you need. You can access sales dashboard anywhere to get fresh data and use any minute to see how your business can improve.Business Graphics Software
ConceptDraw PRO is a business graphics software that allows you improve your business using Sales Performance Dashboard helps you analyze your data more efficiently.
 Sales Dashboard
Sales Dashboard solution extends ConceptDraw PRO software with templates, samples and library of vector stencils for drawing the visual dashboards of sale metrics and key performance indicators (KPI).
Business Intelligence Dashboard Software
ConceptDraw PRO is a business intelligence dashboard software that allows you produce sales dashboard that suites your specific needs. To see how your business can improve with sales dashboards select KPI and start tracking it.Sales Teams are Inherently Competitive
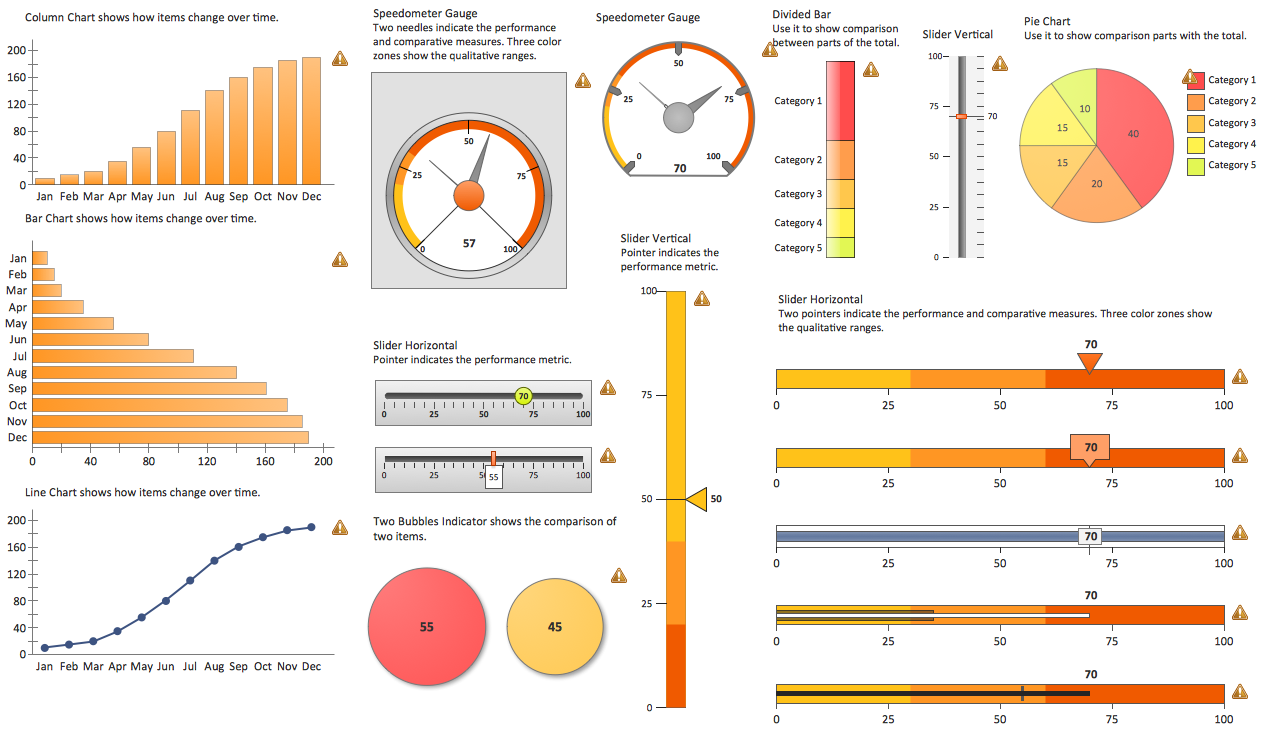
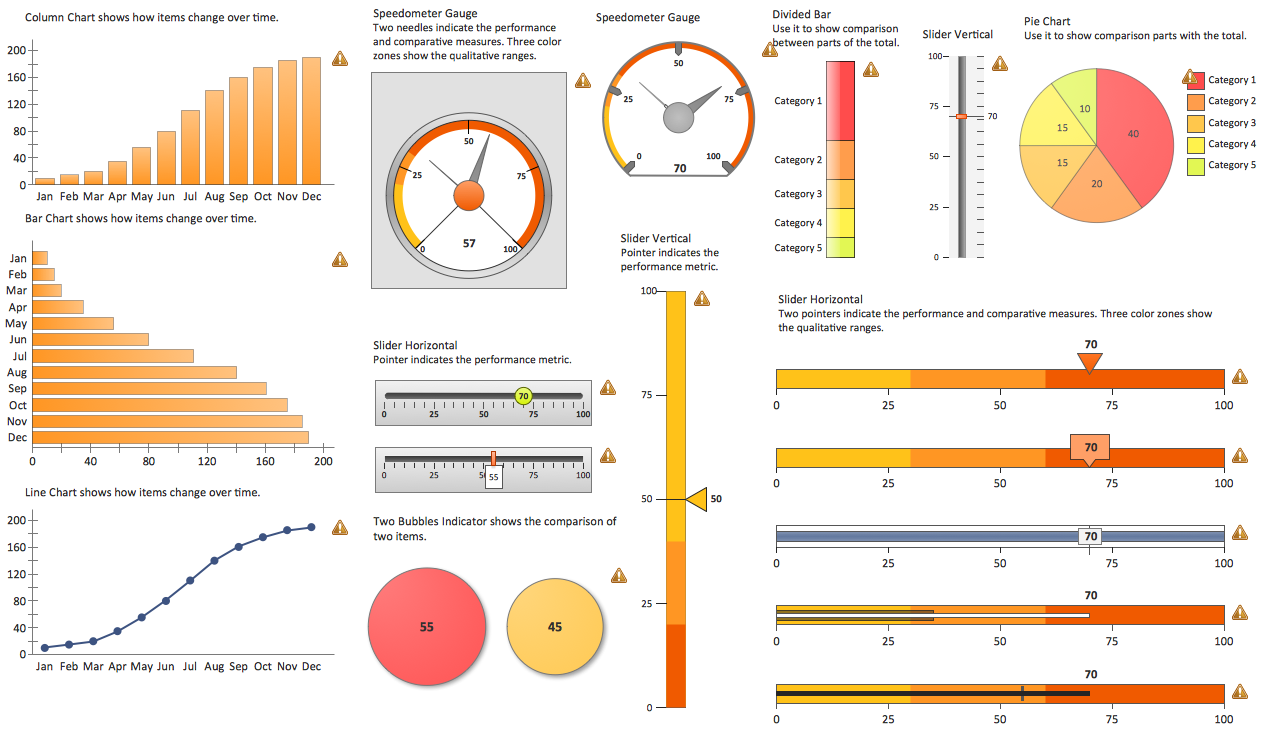
Sales teams are inherently competitive, so you don't need to invent extra ways to stimulate the competition. At the same time, you can provide the team with a sales dashboard shows company, team and personal KPI to make the competition clear.The vector stencils library "Sales dashboard" contains 27 charts and indicators: bar charts, line graphs, gauges, sliders, pie charts, divided bar diagrams, bubble indicators, bullet indicators.
The design elements library "Sales dashboard" for the ConceptDraw PRO diagramming and vector drawing software is included in the Sales Dashboard solution from the Marketing area of ConceptDraw Solution Park.
The design elements library "Sales dashboard" for the ConceptDraw PRO diagramming and vector drawing software is included in the Sales Dashboard solution from the Marketing area of ConceptDraw Solution Park.
Reporting & Data Visualization
Using professional reporting and data visualization is the way your business can improve. ConceptDraw Sales Dashboard solution allows you produce live dashboards show KPI to monitor you sales activity and results in real time.Reporting Dashboard Software for Business
An effective way to improve your business is using reporting dashboard software. ConceptDraw PRO software extended with the Sales Dashboard solution helps you monitor all KPI on the one screen in real time.Customer Relationship Management
Customer relationship management is an important component of sales success. Visualizing sales data you may put some KPI related to customers relationship management to your Sales dashboard and track this important aspect in real time.KPIs and Metrics
The choice of KPIs and metrics you use is key point of success when measuring sales process. Visualizing sales data using ConceptDraw Sales Dashboard solution for ConceptDraw PRO gives you a choice from numerous pre-designed indicators for different metrics you may need.Data Visualization Software Solutions
To see how your business can improve you can try data visualization software solutions that allows you visualize all your sales KPI in one sales dashboard allows you monitor and analyse sales activities.Sales Dashboards for Your Company
ConceptDraw PRO software extended with the Sales Dashboard solution allows you produce sales dashboards for your company easily. You can start from samples and templates delivered with the solution and then modify them to get a dashboard that suites your specific needs.The Facts and KPIs
Visualizing sales data help you see the facts and KPIs about your sales process to make conclusions and see how your business can improve.- KPI Dashboard | Sales Dashboards for Your Company | Sales KPI ...
- Business Intelligence Dashboard Software | Sales Dashboard ...
- KPI Dashboard | Reporting Dashboard Software for Business | Sales ...
- Dashboard | Sales Dashboard | KPI Dashboard | Free Dashboard ...
- Design elements - Sales KPIs and metrics | Performance Indicators ...
- Sales Dashboard - Access Anywhere | Business Intelligence ...
- Sales performance dashboard | KPIs and Metrics | Design elements ...
- Sales Dashboard Template | Dashboard | Sales Dashboard - insight ...
- Best Graph For Total Sales By Quarter
- Percentage Pie Chart. Pie Chart Examples | Sales Dashboards for ...
- KPIs and Metrics | The Facts and KPIs | Sales Dashboards for Your ...
- Sales Dashboard Template | KPI Dashboard | Data Visualization ...
- Design elements - Sales dashboard | Sales Dashboard - Access ...
- Sales Dashboard - Access Anywhere | Business Intelligence ...
- Sales Dashboard Examples | KPI Dashboard | Sales Dashboard ...
- Sales Dashboard Template | Business Intelligence Dashboard ...
- Dashboard Software | Sales Dashboard - Access Anywhere | Data ...
- Android User Interface | Sales Dashboard | Plant Layout Plans ...
- Business Intelligence Dashboard Software | Reporting Dashboard ...
- Performance Indicators | What is a KPI? | Sales Dashboard ...


