How To Create Project Report
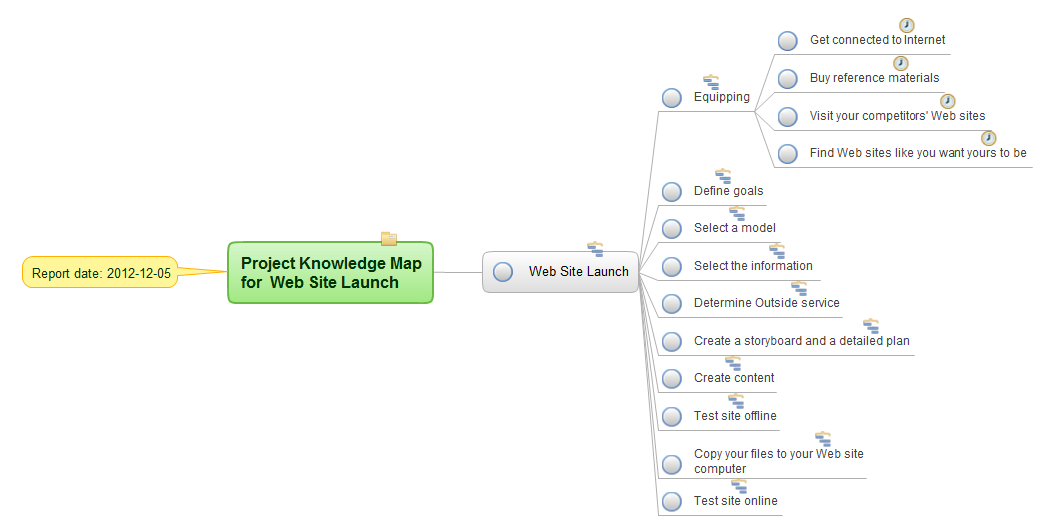
ConceptDraw PROJECT contains an extensive tool set to help project managers. The rich data visualization capability that is provided by ConceptDraw products helps you create project dashboards, one-click reports, multi-project views, Gantt charts, and resource views. Let′s learn how to get maximum value using ConceptDraw PROJECT!SWOT Analysis
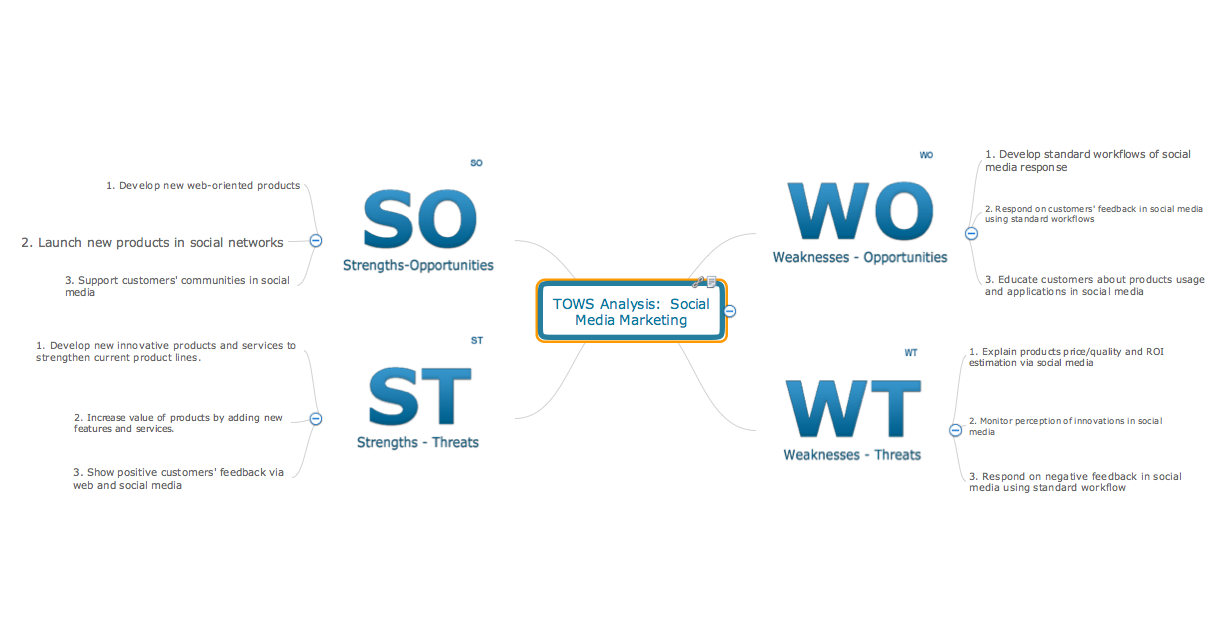
Using mind mapping to define Strengths, Weaknesses/Limitations, Opportunities, and Threats is a natural fit. SWOT mind maps quickly capture your ideas, and allow you to add and subtract easily, ensuring you don’t overlook any important items.Relative Value Chart Software
Relative value is a value measured in the terms of liquidity, risks, return of one investment or financial instrument relative to another. Relative values are widely used in:business, economics, investment, management, marketing, statistics, etc. ConceptDraw DIAGRAM software is the best for drawing professional looking Relative Value Charts. ConceptDraw DIAGRAM provides Divided Bar Diagrams solution from the Graphs and Charts Area of ConceptDraw Solution Park.Business Tools Perceptual Mapping
This sample shows the Perceptual map. It was created in ConceptDraw DIAGRAM diagramming and vector drawing software using the Matrices Solution from the Marketing area of ConceptDraw Solution Park. Perception Mapping helps organizations measure and transform all aspects of their business, people and culture. Perception Mapping allows to represent the complex relationships graphically, helps identify potential problems of the organization and make the best decisions.ConceptDraw PROJECT Project Management Software Tool
ConceptDraw PROJECT is simple project management software. If you are on the fast track in your career and start facing such challenges as coordination many people, coordination tasks and works, manage project with a great deal of time and money involved - it is the right time to get Project management tool involved in your work.Marketing Analysis Diagram
An example of marketing analysis diagram, can be used to analyse product market and define marketing strategy. This types of charts used by small business project management for making presentations on market shares, it used by marketing project management software and project management tracking tools for reporting results and statuses.Cause and Effect Diagram
ConceptDraw DIAGRAM software extended with Fishbone Diagrams solution from the Management area of ConceptDraw Solution Park is perfect for Cause and Effect Diagram creating. It gives the ability to draw fishbone diagram that identifies many possible causes for an effect or a problem. Causes and Effects are usually grouped into major categories to identify these sources of variation. Causes and Effects in the diagram show relationships among various factor. Fishbone diagram shows factors of Equipment, Process, People, Materials, Environment and Management, all affecting the overall problem.Internet Marketing Infographic
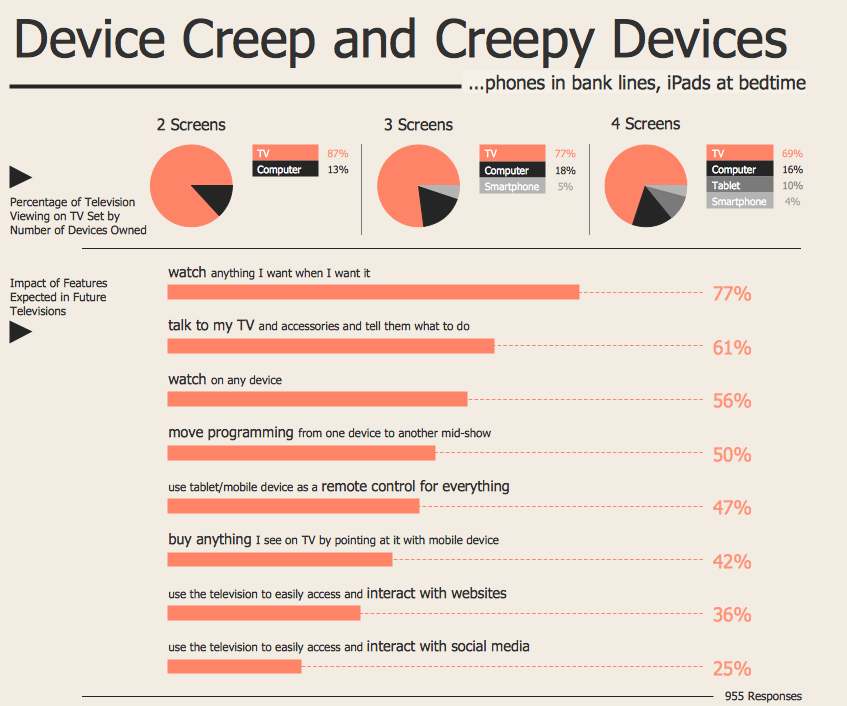
ConceptDraw DIAGRAM extended with Marketing Infographics Solution from the Business Infographics Area is the best software for creating Internet Marketing Infographic of any complexity in minutes. Make sure in it right now!SWOT matrix template
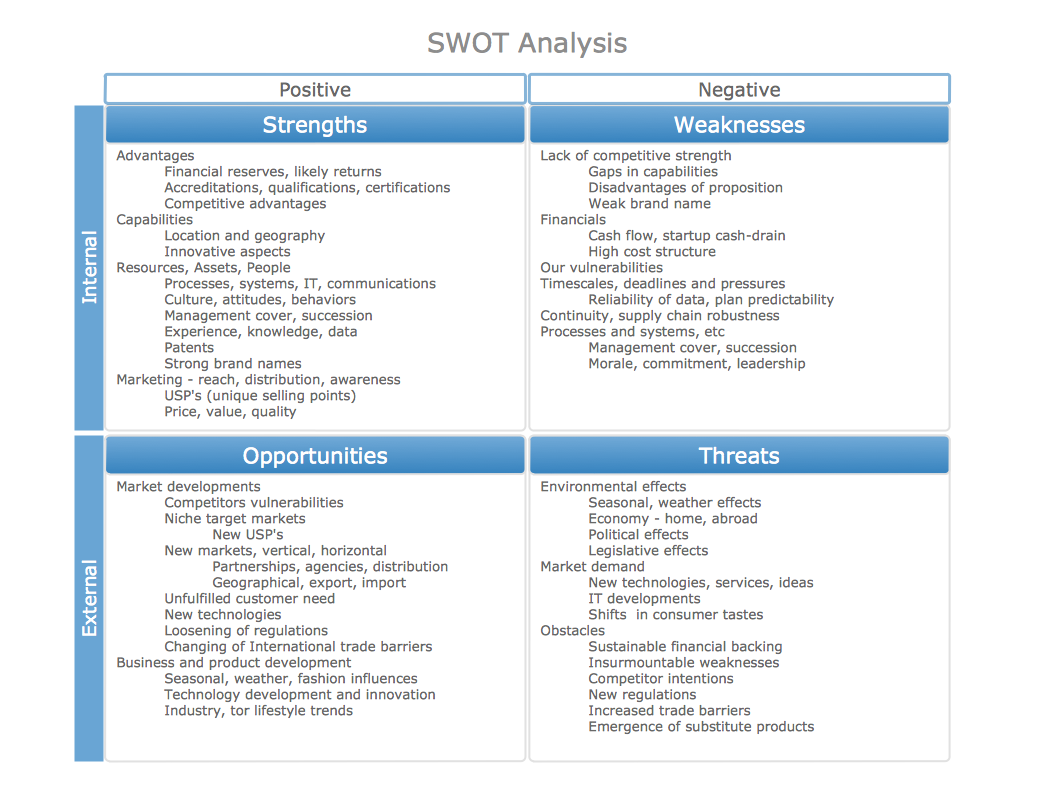
SWOT matrix templates is part of SWOT Analysis solution from ConceptDraw Solution Park.Marketing Research Project
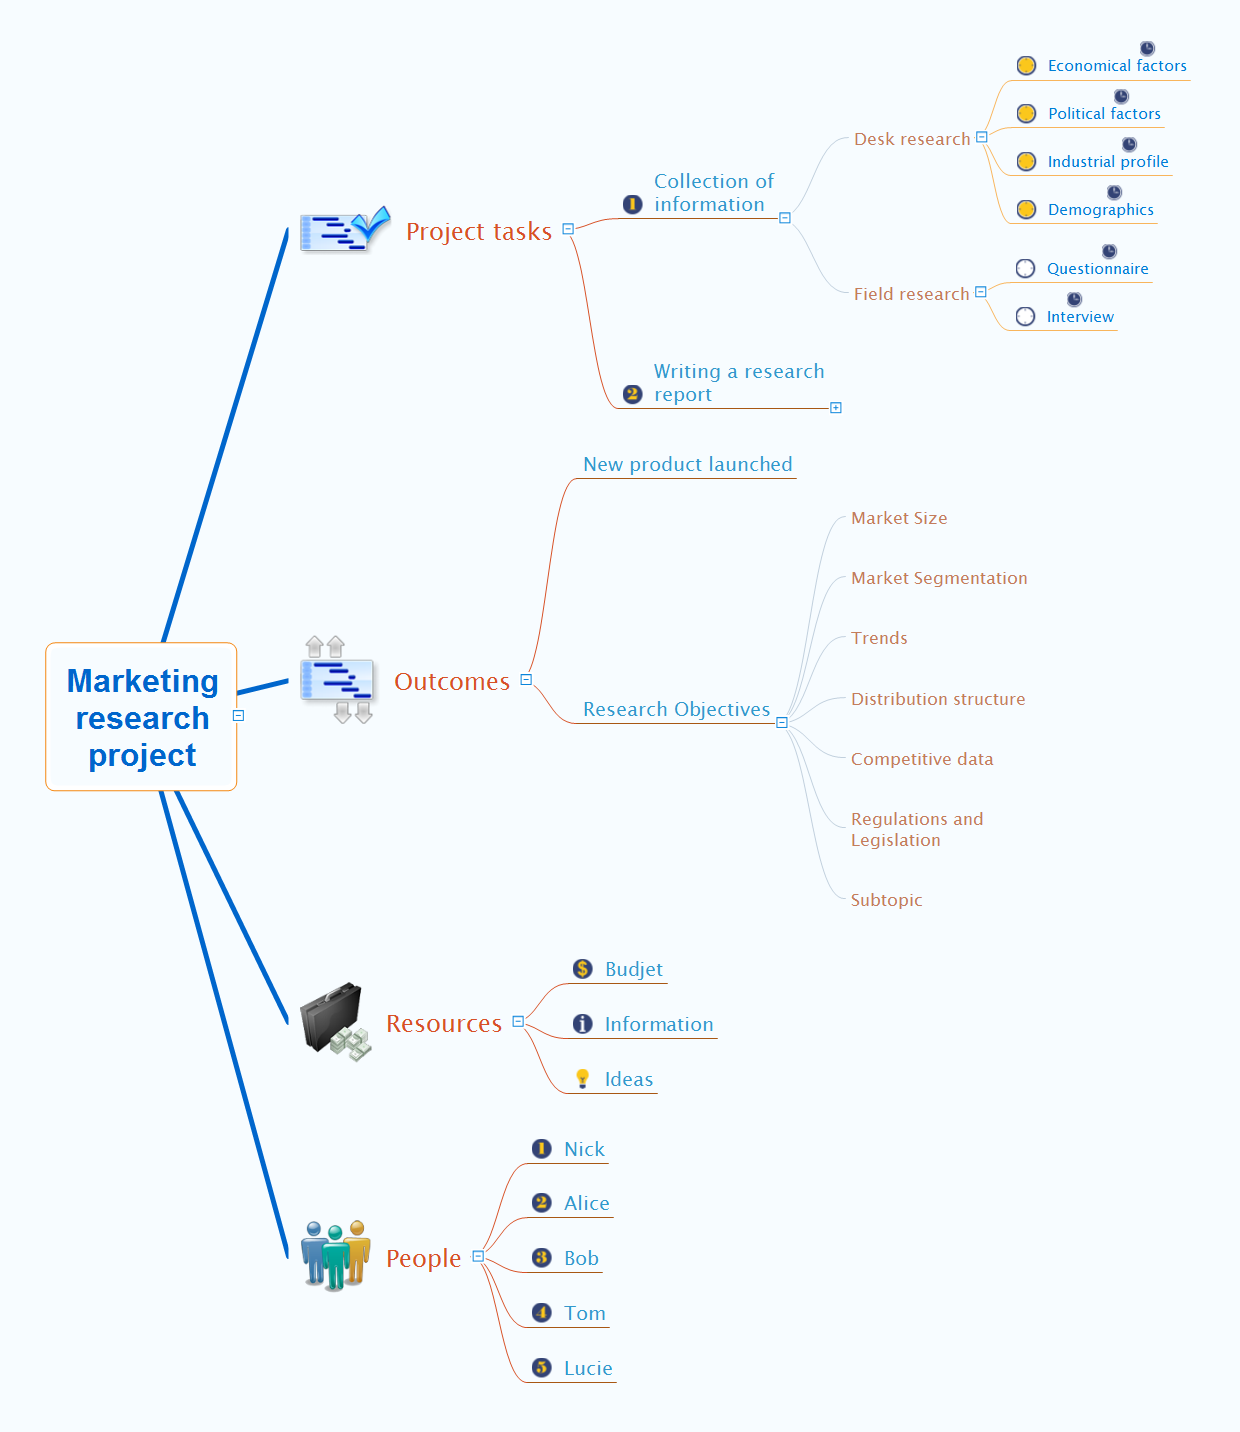
Researches are the main tools used to expand the boundaries of our knowledge in all fields of science and business. Today, it is impossible to authentically explain the behavior and intentions of customers of the company, its dealers and competitors, without serious marketing researches. The efficiently gathered, reliable and accurate information is extremely important when making the marketing decisions. It gives a company the opportunity to achieve a certain competitive advantage, to reduce financial risks, dangers and uncertainties, to objectively determine the attitude of consumers, to analyze external environment, to improve the strategy and tactics of market behavior. The marketing researches cover the market, competitors, consumers, prices, internal capacity of an enterprise and many other factors, but themselves they do not guarantee a success. However their quality performance and skillful use contribute to the achievement of company objectives. ConceptDraw MINDMAP is convenient for professional designing the Mind Maps, which represent knowledge about the process of marketing researches, visually reflect the results of marketing researches, organize the information about tasks, resources, outcomes and people for a marketing research project.How to Make SWOT Analysis in a Word Document
A SWOT Analysis is a popular tool of the strategic planning which is used to evaluate the Strengths, Weaknesses, Opportunities, and Threats that are involved in any businesses. Use of mind maps allows you to collect a lot of information used for SWOT Analysis, visually structure it and also identify the relationships between different parts of this information. SWOT and TOWS Matrix Diagrams solution for ConceptDraw Solution Park combines professional visual advantages of ConceptDraw MINDMAP software and presentation capabilities of ConceptDraw DIAGRAM , which together provide a complete work solution. The SWOT and TOWS diagrams, matrices or mind maps produced in ConceptDraw DIAGRAM using the predesigned vector objects or filling the ready templates, can be then easily exported to Microsoft Word, Microsoft Visio, Microsoft PowerPoint, Adobe PDF, and many other electronic file formats. The possibility of export makes easy the use of SWOT diagrams designed in ConceptDraw DIAGRAM and lets you efficiently collaborate even with people who maybe don't have this software.Process Flow app for macOS
Use ConceptDraw DIAGRAM diagramming and business graphics software to draw your own flowcharts of computer algorithms.SWOT Analysis matrix templates and samples
SWOT Analysis solution extends ConceptDraw MINDMAP and ConceptDraw DIAGRAM products with easy-to-use SWOT Analysis tools.Strategy Map
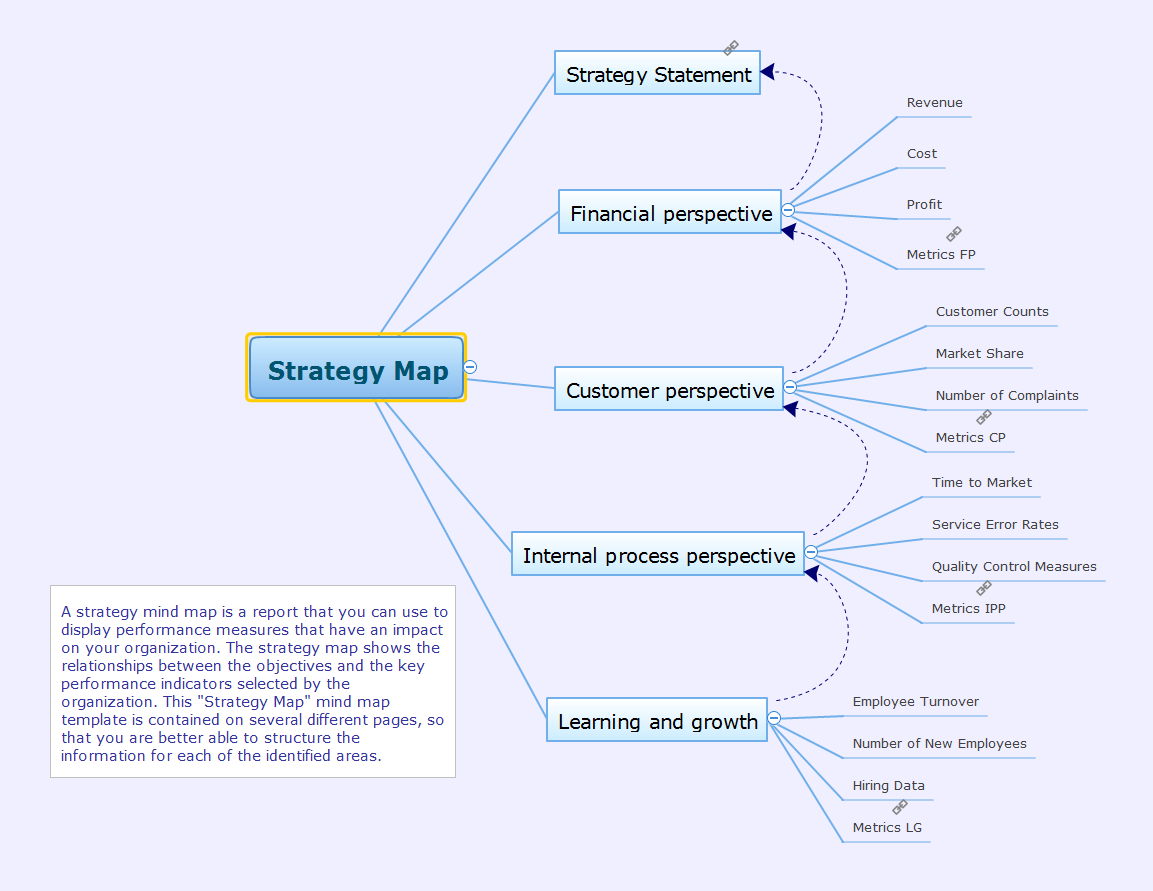
The enterprise strategy is an interrelated perspective plan of actions designed to achieve long-term goals according to company's own potential as well as external factors. Development of strategy is one of the main functions of management. The strategy determines the enterprise's direction of development, it covers all major functions and departments: supply, production, finance, marketing, personnel, scientific researches and development, and helps managers to make informed decisions when choosing a method of actions. The choice by managers of a particular strategy means that of all the possible paths of development and ways of actions, it is decided to choose one direction in which the enterprise will evolve. Without a strategy the administration has no thought-out plan of actions, no guide in the world of business, and no unified program to achieve desired results. Since in the process of strategic decision making always appear new alternatives and is executed the search of the most preferred solutions, the initially designated goals of strategic development can be subsequently adjusted. This Mind Map template of a strategy map helps to display a variety of performance measures, which can have an impact on your organization.How To Use Collaboration Tool in Project Management
Collaboration tool for project management enables you to give a new role to knowledge management and document sharing within your team.
How to Design a Good Workflow
To design a good workflow you have to focus on process analysis, not using the a drawing tool. This is more possible with ConceptDraw DIAGRAM software that brings the most natural drawing manner you have ever tried. First, define steps and procedures using simple rectangle shape, then select all shapes and click the Chain button to connect all shapes just in one click. After that you are able to modify some relations if needed.Matrices
ConceptDraw DIAGRAM extended with Matrices Solution from the Marketing Area of ConceptDraw Solution Park is a powerful software for drawing various types of Marketing Matrices: Ansoff Matrix, BCG Matrix, Deployment Chart, Feature Comparison Chart, Competitive Strategies Matrix, Flow Process Chart, Porter's Value Chain Diagram, Positioning Map, and many others.PDPC
ConceptDraw DIAGRAM extended with Seven Management and Planning Tools Solution from the Management Area of ConceptDraw Solution Park is the best software for drawing all types of diagrams from the Seven Management and Planning Tools: Affinity Diagram, Relations Diagram, Prioritization Matrix, Root Cause Analysis Tree Diagram, Involvement Matrix, PERT Chart, and Risk Diagram (PDPC).Polar Graph
This sample shows the Polar Graph. The Polar Graph is a graph in the polar coordinate system in which the each point on the plane is defined by two values - the polar angle and the polar radius. The certain equations have very complex graphs in the Cartesian coordinates, but the application of the polar coordinate system allows usually produce the simple Polar Graphs for these equations.TQM Diagram Tool
The Total Quality Management Diagram solution helps you and your organization visualize business and industrial processes. Create Total Quality Management diagrams for business process with ConceptDraw software.- SWOT Analysis Tool for Small Business | How Do Fishbone ...
- SWOT Analysis | SWOT and TOWS Matrix Diagrams | Gant Chart in ...
- ConceptDraw PROJECT Project Management Software Tool ...
- HVAC Marketing Plan | Flowchart Example: Flow Chart of Marketing ...
- SWOT Analysis
- Gant Chart in Project Management | Gantt charts for planning and ...
- How to Create Presentation of Your Project Gantt Chart | Gantt chart ...
- Project Timeline | Gant Chart in Project Management | Best Program ...
- Process Flowchart | Sample Project Flowchart. Flowchart Examples ...
- SWOT Analysis Tool for Small Business | TQM Diagram Tool | SWOT ...
- Gant Chart in Project Management | What Constitutes a Project ...
- Competitor Analysis | Ansoff Matrix | Gant Chart in Project ...
- Gant Chart in Project Management | Examples of Flowcharts, Org ...
- Gant Chart in Project Management | ConceptDraw PROJECT ...
- Good Flow Chart app for Mac | Gant Chart in Project Management ...
- Gantt chart examples | Gant Chart in Project Management | How to ...
- Competitor Analysis | Successful Strategic Plan | SWOT Analysis ...
- Gantt chart examples | Gant Chart in Project Management | Gantt ...
- Gant Chart in Project Management | Gantt chart examples ...
- Construction Project Chart Examples | Gantt Chart Templates | Gant ...

