Basic Diagramming
Create flowcharts, organizational charts, bar charts, line graphs, and more with ConceptDraw DIAGRAM.
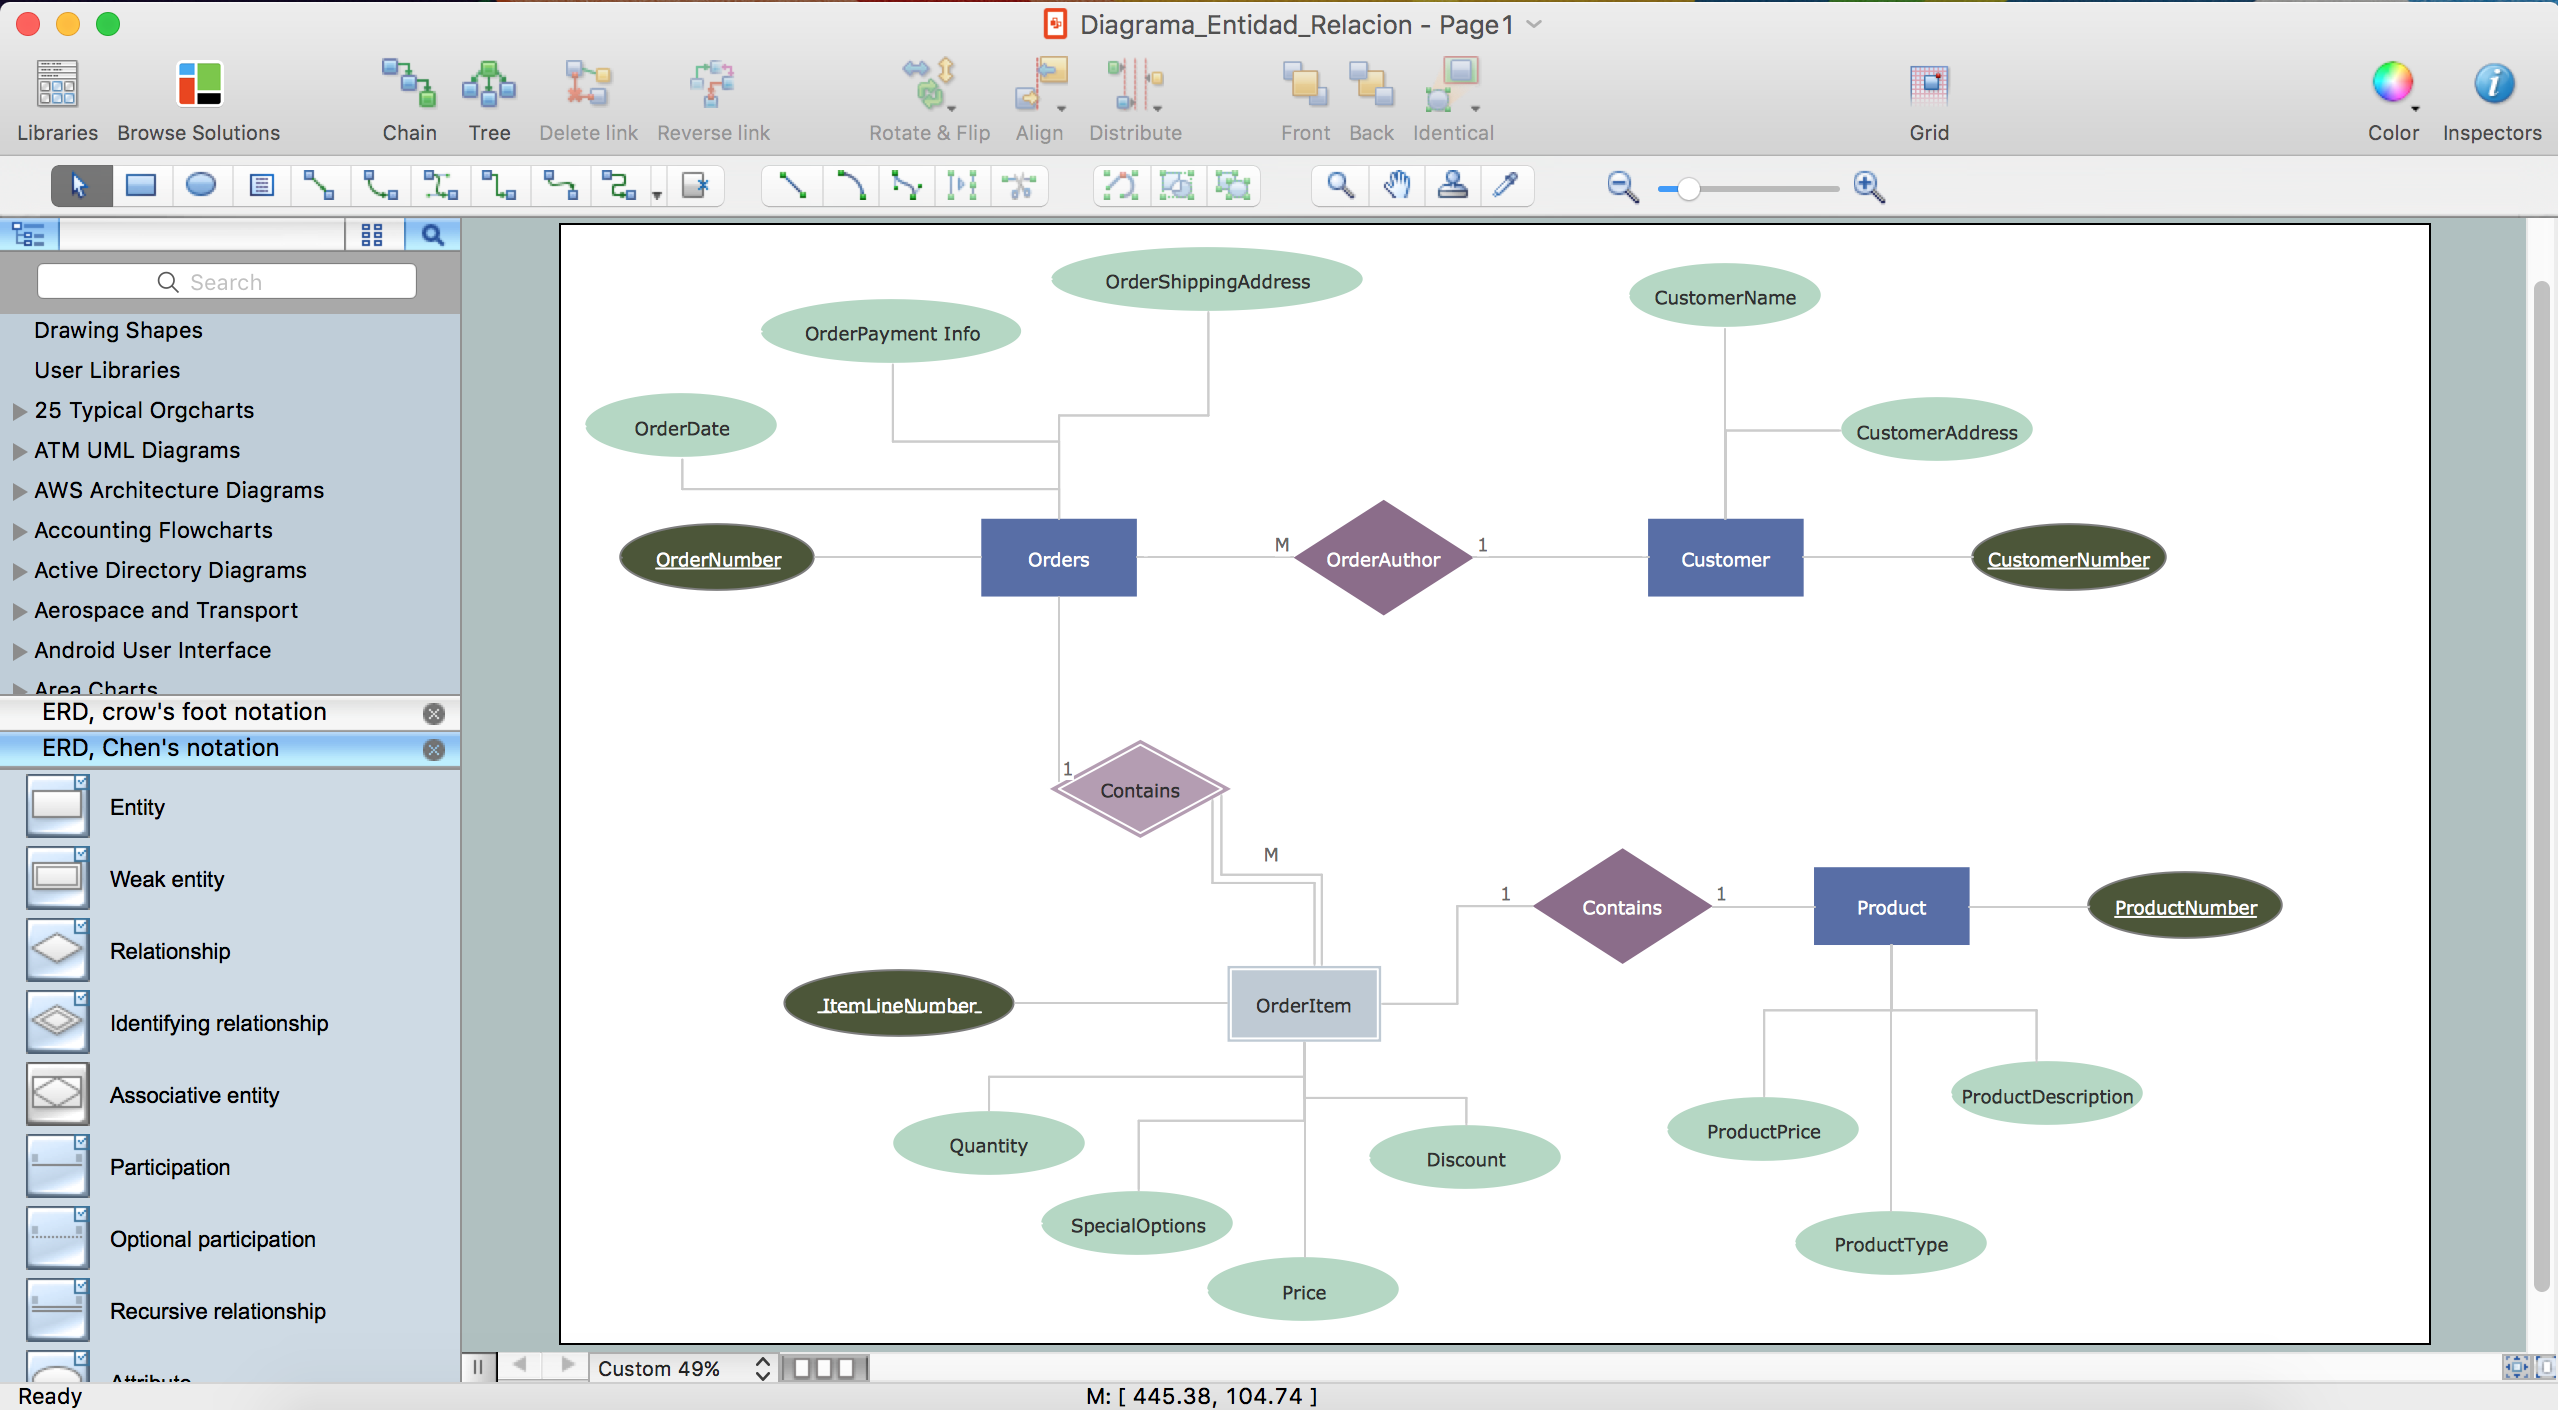
ER diagram tool for OS X
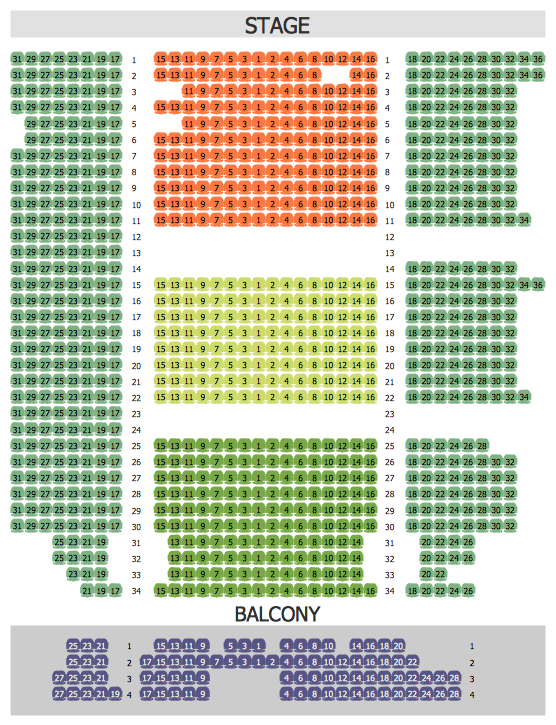
ER diagram is the most popular database design tool which lets create graphical representations of database tables, their columns and also relationships. As for the Mac users, they are very interested in powerful database diagramming tools and ER diagram tool for OS X to design professional looking E-R Diagrams and ERD drawings. ConceptDraw DIAGRAM software on Mac OS X gives the ability to easy draw ERDs.Building Drawing Software for Design Seating Plan
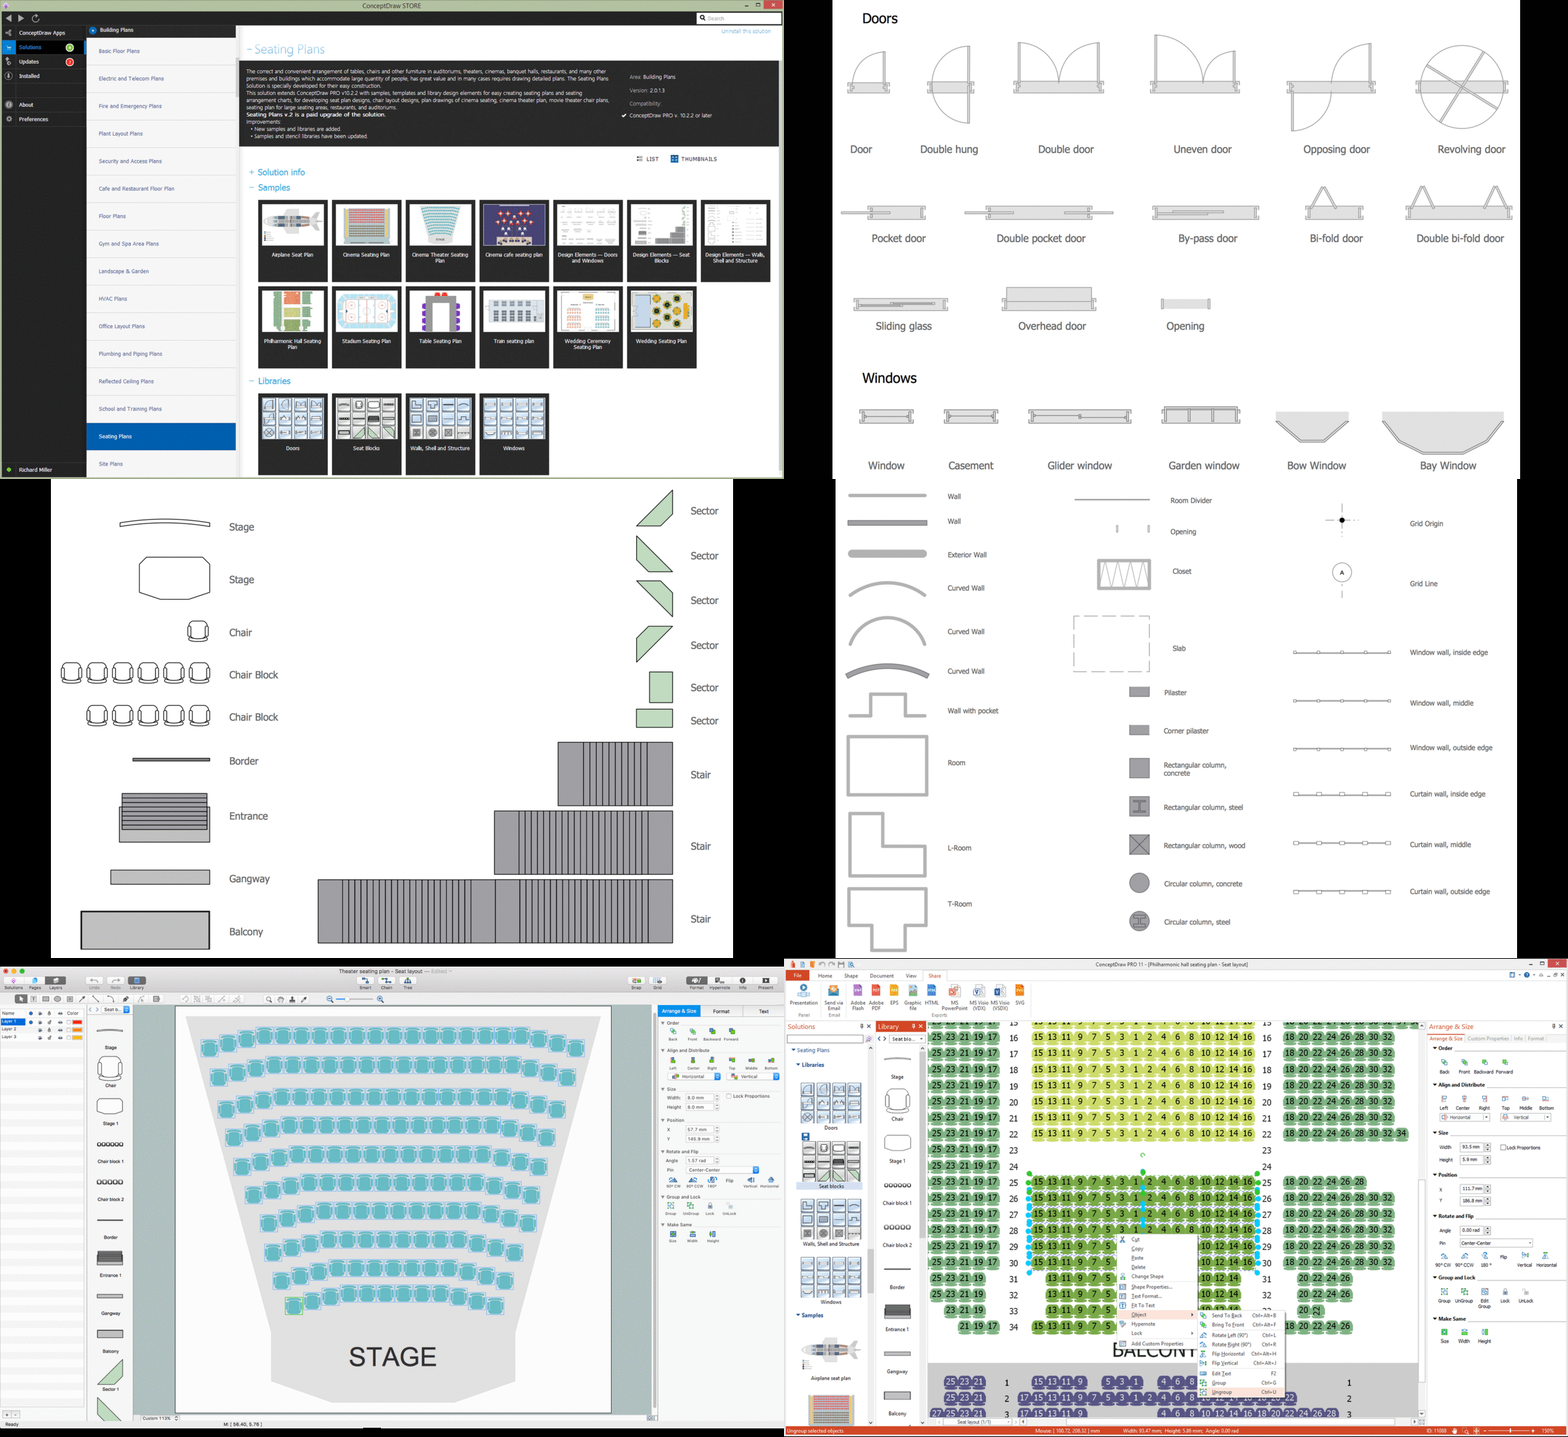
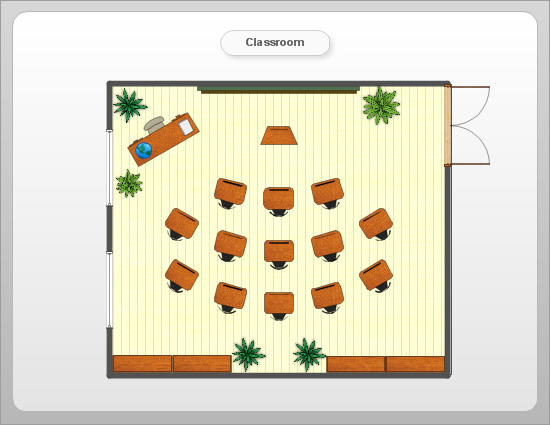
A Seating Plan is a scheme that illustrates the arrangement of seats on the plan of specific place. The seats can be located separately or grouped in rows like in stadiums. Usually they are numerated allowing spectators to choose them beforehand and have a guaranteed seat. It is especially useful for cinemas and theaters, where the places differ according to their price range. When all seatings are equal, it is used the open seating scheme and each client can choose any free seat. Each of these seating systems has many own advantages, it is also possible to mix them. Seating Plans, Schemes and Drawings are popular and widely used for purchase and sale the entering tickets to theatres, cinemas, stadiums, trains, airplanes, etc. They are also useful for beforehand planning and assignment the seats on weddings, banquets, and other events. ConceptDraw DIAGRAM enhanced with Seating Plans solution offers the helpful building drawing software tools for design Seating Plan using the predesigned templates and vector elements of doors, windows, walls, seats, etc.
How To Create Restaurant Floor Plan in Minutes
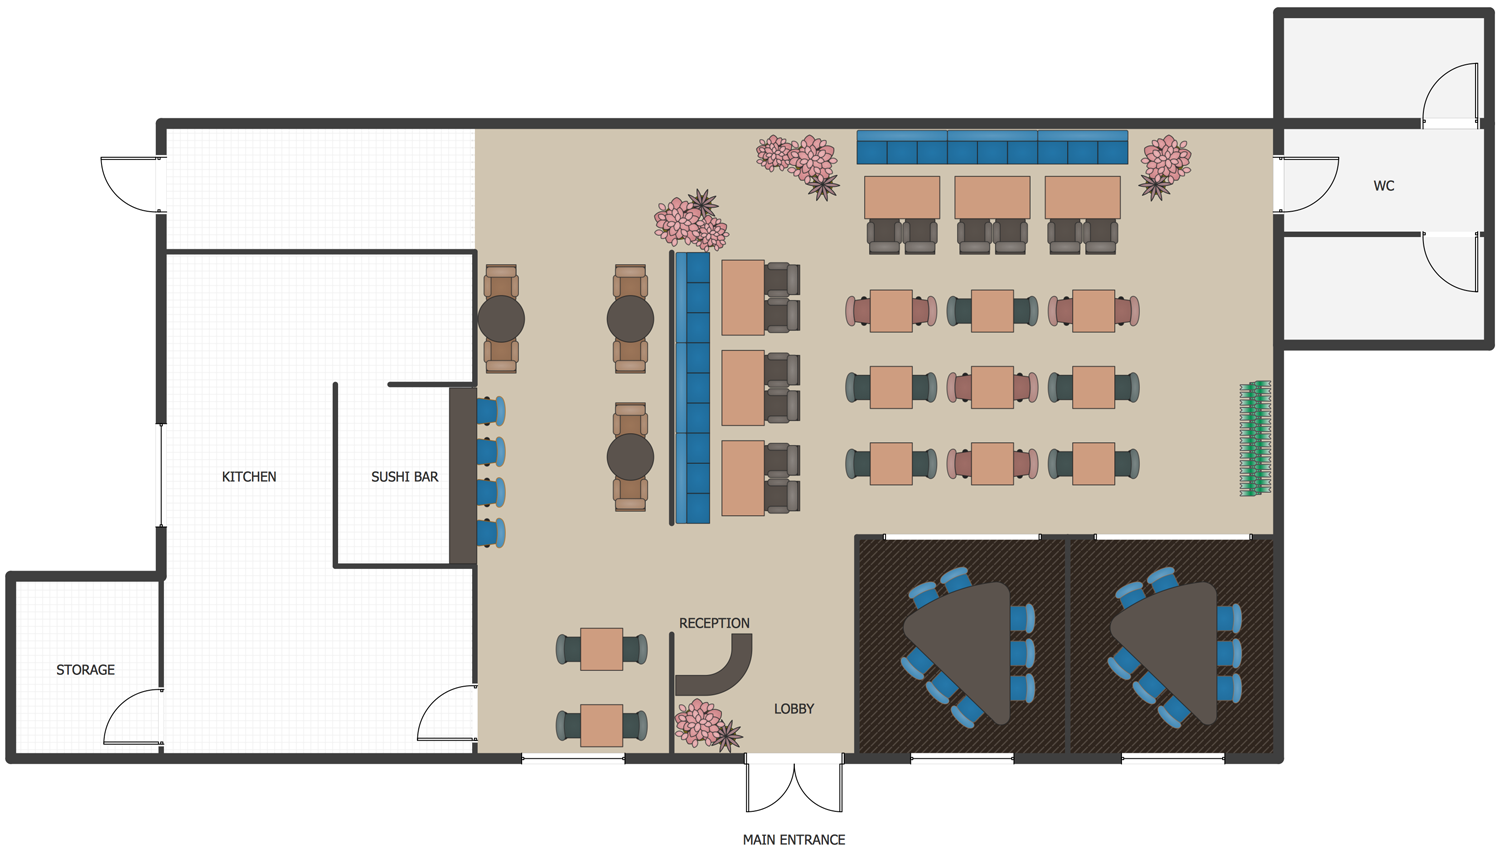
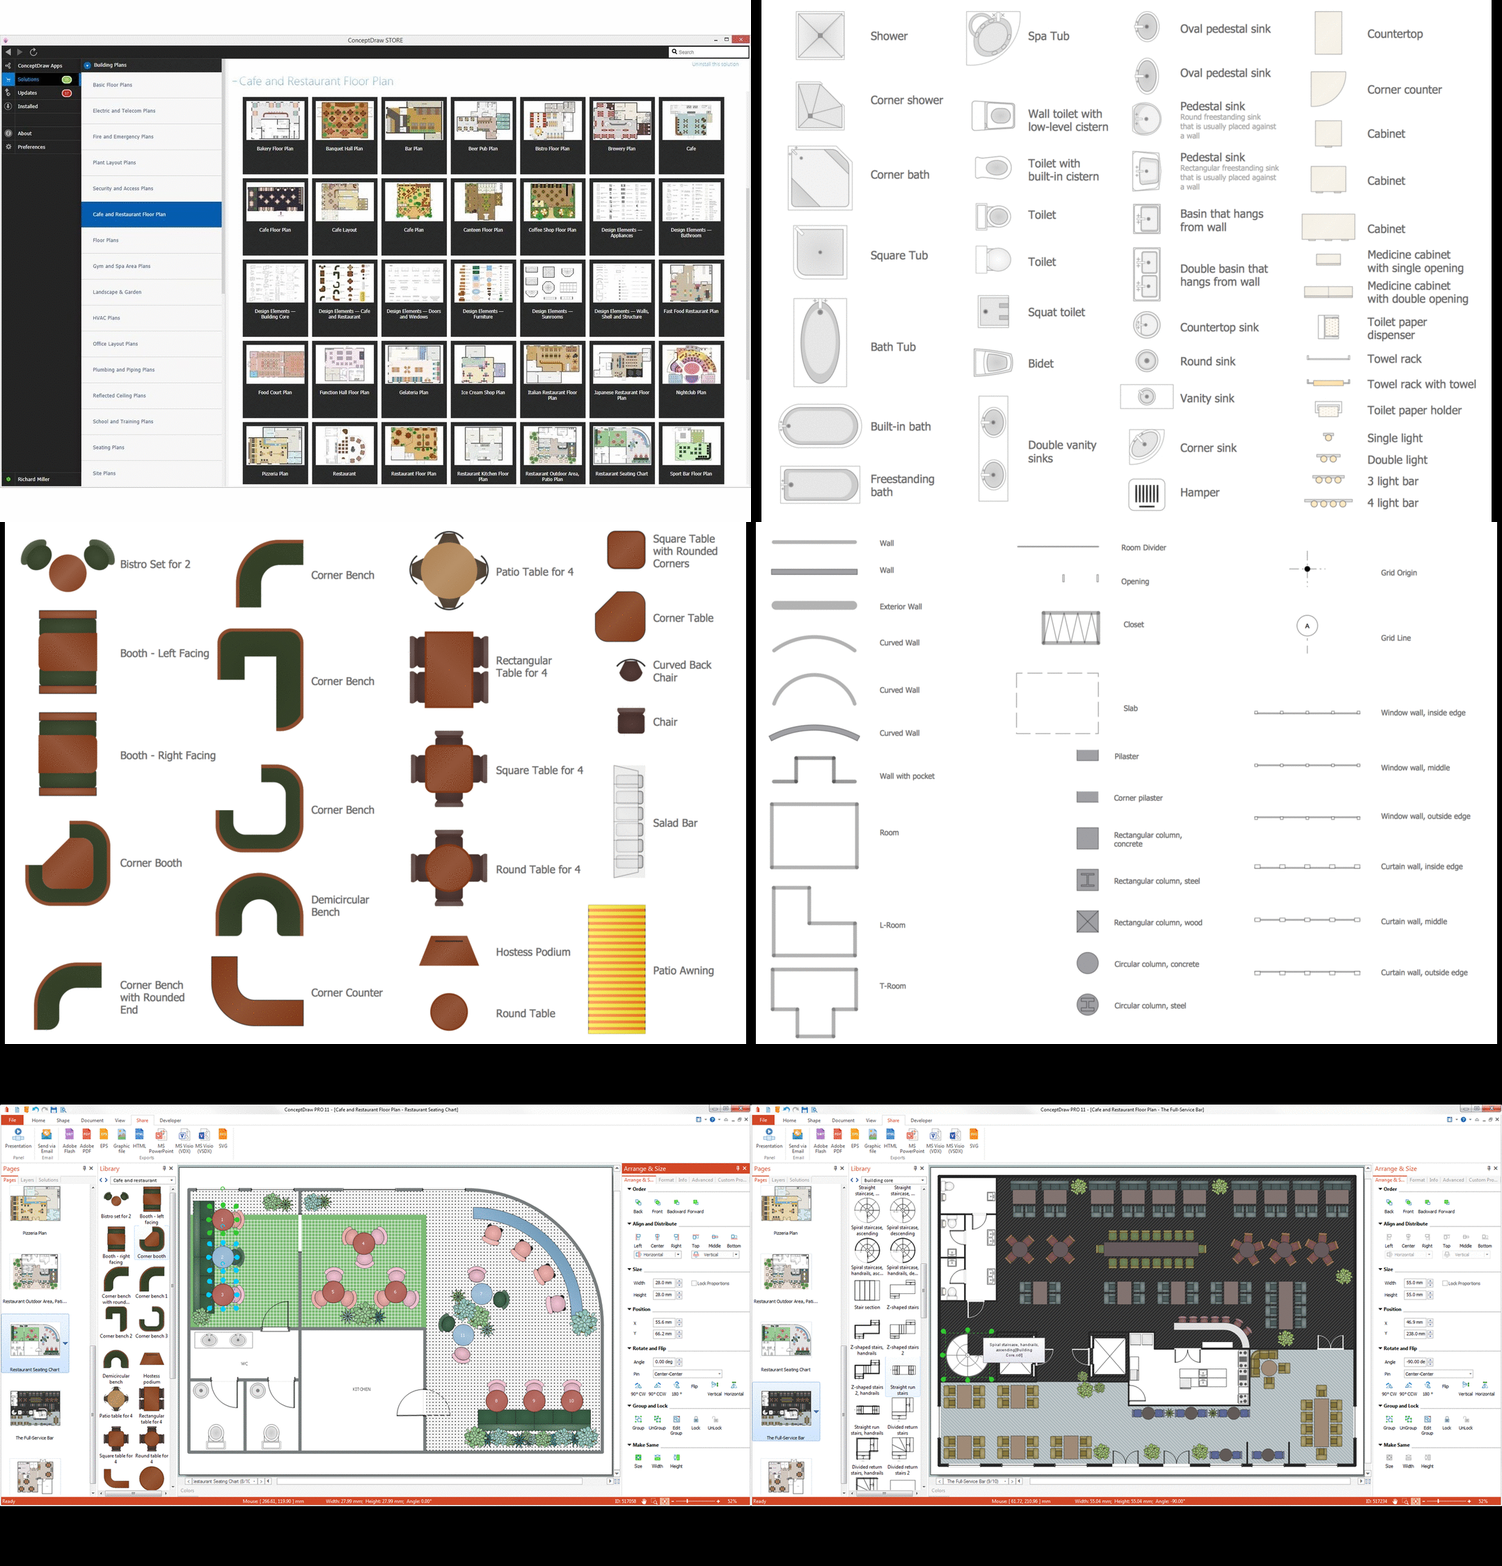
Developing Floor Plans, Design Drawings, Plans of Furniture Placement for restaurants and cafes is one of the most responsible and important steps at their construction and designing. Selection of favorable design, the right style of furniture and decors largely determine the success and atmosphere of the institution. The restaurant floor planner ConceptDraw DIAGRAM is a perfect choice for architects and designers. Enhanced with Cafe and Restaurant Floor Plans solution it offers a lot of extensive vector symbol libraries and building plan elements for drawing Restaurant floor plans, Restaurant layouts, Restaurant furniture layouts, Cafe floor plans, Bar area floor plan, Fast food restaurant plan, etc. With ConceptDraw DIAGRAM you don't need to be an artist to create great-looking restaurant floor plan drawings in minutes, all needed drawing tools are delivered by Building Plans area solutions. Construct your own general plan of restaurant's premises, choose the furniture for your taste from the Cafe and Restaurant Floor Plans solution libraries and arrange it on the plan as you desire fast and easy. ConceptDraw DIAGRAM has many of the features found in Visio for Mac such as Drawing, Connection, Shape and Editing Tools.
Chemistry Drawing Software
ConceptDraw DIAGRAM extended with Chemistry solution from the Science and Education area is a powerful chemistry drawing software that provides the useful tools to help you design all kinds of chemistry drawings and illustrations, chemical schemes and diagrams of formulas, reaction schemes and lab set-ups of any complexity.Best Vector Drawing Application for Mac OS X
ConceptDraw DIAGRAM creates drawings, diagrams and charts with great visual appeal in Mac OS X.How to create Cafe Floor Plan Design
Cafes and restaurants are the premises, the main purpose of which is to organize the proper rest of persons. The basis for successful development of this business is the good mood of visitors that is formed under the influence of many factors including the pleasant design and interior of the cafe, its color solution, style, decoration elements, lighting, furniture, etc. That is why so many demands are presented to the style, design and decoration of the cafe, the main are originality, comfort and convenience of each guest. The cafe's interior design should be fully completed, every item and accessory should harmoniously supplement the overall interior picture. The competent approach and strict observance of all recommendations the specialists on planning and arrangement of cafe are very important, they guarantee the success of your institution. ConceptDraw DIAGRAM enhanced with powerful Cafe and Restaurant Floor Plan solution is easy-to-use cafe floor plan design software, which helps effectively develop Cafe designs, Cafe and Restaurant floor plans and layouts of any complexity.Seating Arrangement
ConceptDraw DIAGRAM diagramming and vector drawing software extended with Seating Plans solution from the Building Plans area of ConceptDraw Solution Park is the best for quick and easy drawing the seating arrangement plans.Optimize a Workflow
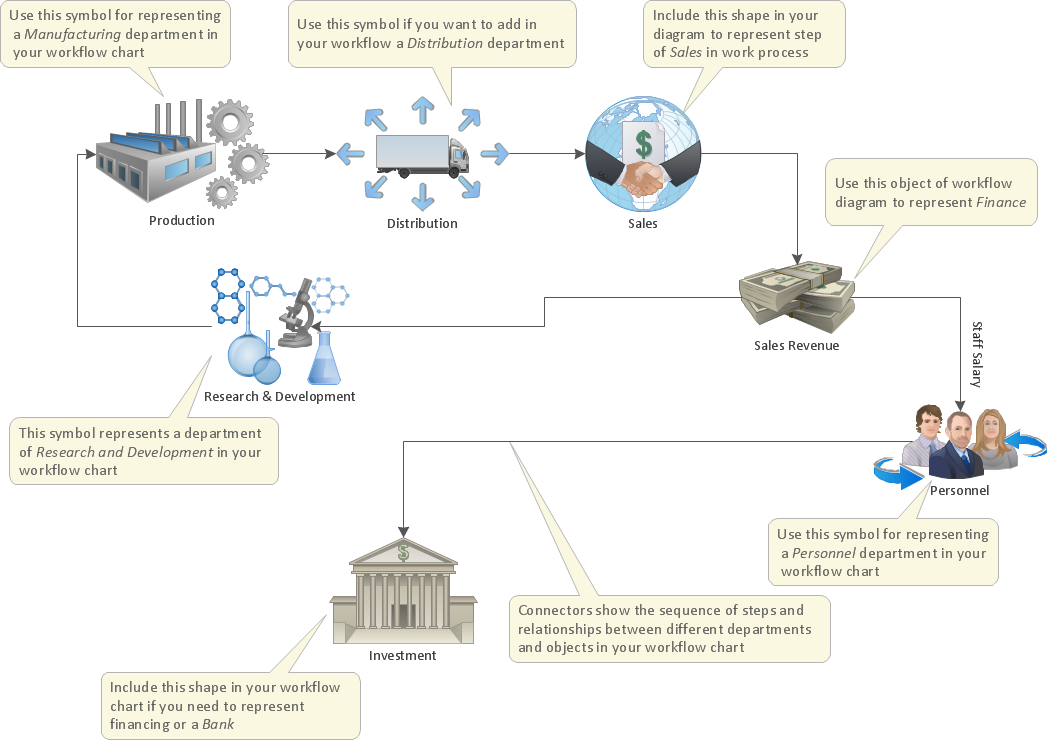
The first step to optimize a workflow is to get its visual depiction. Then you can analyse and optimize the workflow making changes to your workflow diagram. We recommend to use ConceptDraw DIAGRAM software extended with the Workflow Diagram solution to visualize and optimize your workflow. It allows you produce easy-to-change scalable vector graphic workflow and then present it to your team or partners.ConceptDraw DIAGRAM The best Business Drawing Software
ConceptDraw DIAGRAM is new software for business and technical drawing. Powerful business drawing tools, extensive libraries with pre-drawn shapes, free samples of business drawings, technical drawings and flowcharts, support of many graphic formats enable users to visually develop their business drawings charts and diagrams in any combination of drawings, diagrams and flow charts.Entity Relationship Diagram Software
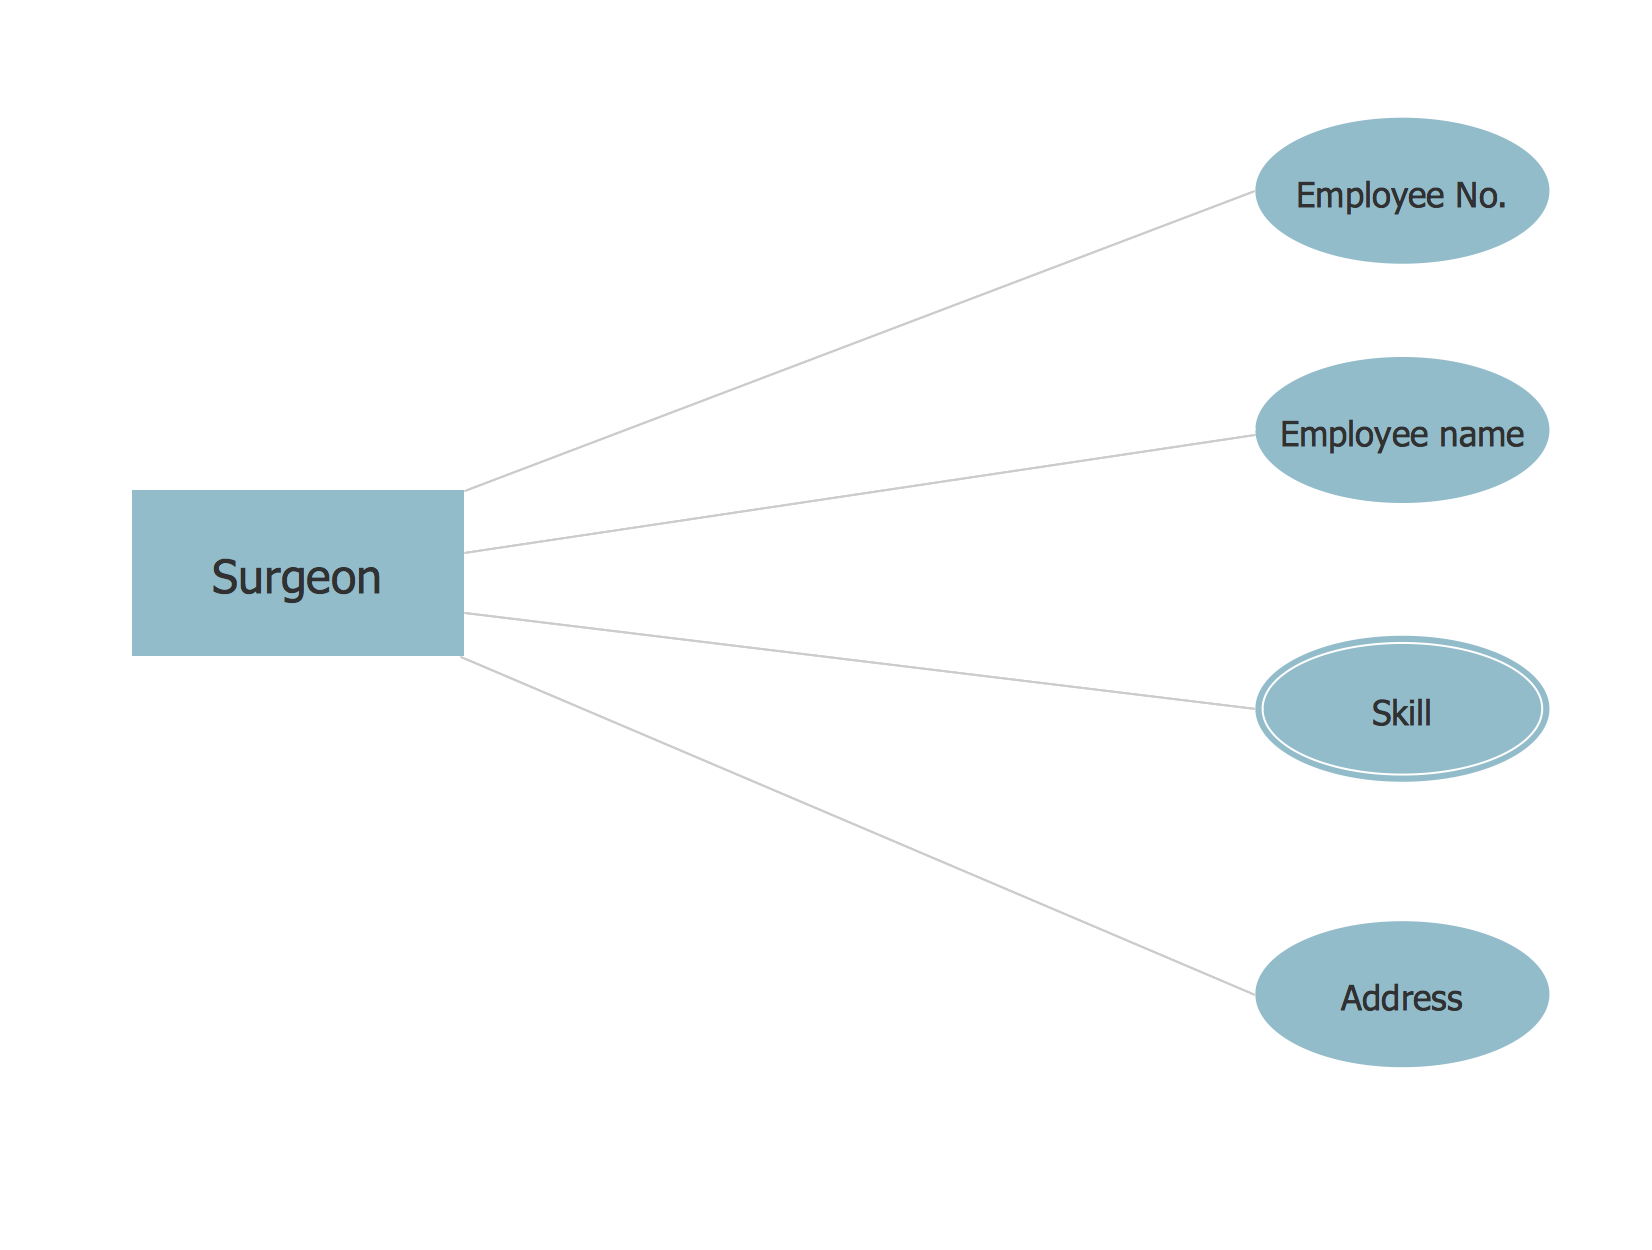
Entity Relationship Diagram (aka ERD, ER Diagram, E-R Diagram) is a well-tried software engineering tool for illustrating the logical structure of databases. Professional ERD drawing is an essential software engineering method for database modeling. Use powerful tools of ConceptDraw DIAGRAM Entity Relationship Diagram Software extended with Entity-Relationship Diagram (ERD) Solution.Chen ERD Diagram
The vector stencils library Chen ERD from the solution Entity-Relationship Diagrams (ERD) contains specific symbols of the Chen ERD notation including entity symbols and relationship symbols for ConceptDraw DIAGRAM diagramming and vector drawing software. The Entity-Relationship Diagrams (ERD) solution is contained in the Software Development area of ConceptDraw Solution Park.HelpDesk
How to Create Marketing Diagrams
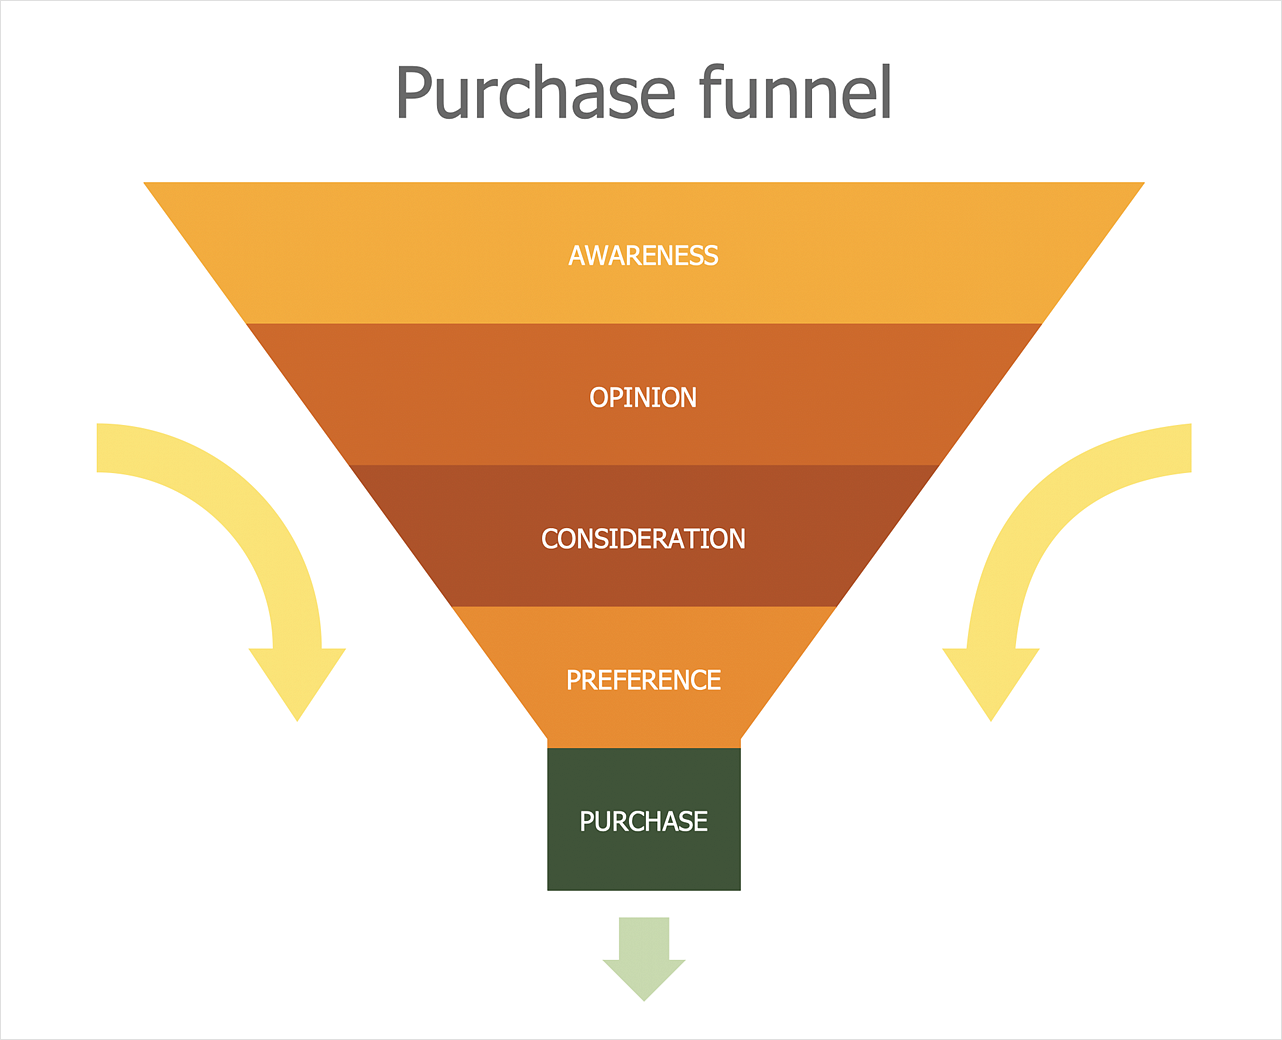
Marketing diagrams created in ConceptDraw DIAGRAM are a great tool to communicate marketing messages and simplify visualization of large amounts of data. Marketing diagrams can be used to show and analogize market-related data and relationships, and to monitor market variability over time.Chemistry Drawings
ConceptDraw DIAGRAM diagramming and vector drawing software extended with Chemistry solution from the Science and Education area is a powerful chemistry drawing software that is ideal for quick and easy designing of various: chemistry drawings, scientific and educational chemistry illustrations, schemes and diagrams of chemical and biological lab set-ups, images with chemical formulas, molecular structures, chemical reaction schemes, schemes of labware, that can be then successfully used in the field of science and education, on various conferences, and so on.Entity Relationship Diagram Symbols
The semantic modeling method nowadays is successfully applied in database structure design. It is effective method of modeling the data structures, which is based on the meaning of these data. As a tool of semantic modeling, there are used different types of Entity-Relationship Diagrams. Entity Relationship Diagram (ERD) is applied to visually and clearly represent a structure of a business database. The main components of ERDs are: entity, relation and attributes. An entity is a class of similar objects in the model, each entity is depicted in the form of rectangle and has the name expressed by a noun. Relation is shown in the form of non-directional line that connects two entities. There are several notation styles used for ERDs: information engineering style, Chen style, Bachman style, Martin Style. The Entity Relationship Diagram symbols used for professional ERD drawing are predesigned by professionals and collected in the libraries of the Entity-Relationship Diagram (ERD) solution for ConceptDraw DIAGRAM software.Chore charts with ConceptDraw DIAGRAM
Chore chart. Draw perfect-looking chore chart. Free chore chart samples. All about chore charts.Components of ER Diagram
Entity-Relationship model gives the possibility to visually describe a database using the components of ER Diagram, entity relationship stencils, relationship symbols, work flow shapes. ER-diagram lets represent the data or entities, attributes of these entities and relationships between them, using standardized Crow’s Foot notation icons or Chen’s notation icons. An entity is an object of the real world, it can exist independently and has the instances which differ in attribute values (properties). The attributes give an unambiguous (uniquely) identification for the instance and are called the primary key, this key can be composite and combine several attributes. ConceptDraw DIAGRAM is a professional software available with Entity-Relationship Diagram (ERD) solution from Software Development area that lets create ERDs for various database systems, using Crow’s Foot and Chen’s notations. It is invaluable tool for software engineers and developers, it supports ODBC-compatible databases (Oracle, MySQL, MS Access, MS SQL, InterBase, Firebird and others).Room planning with ConceptDraw DIAGRAM
ConceptDraw will help you to create the room planning of any configuration quickly and skillfully. ConceptDraw contains a number of ready templates for creation of premises plans, and due to libraries with interior objects existing in the program you will be able to place furniture, denote the location of doors and windows and indicate dimensions.Bubble Chart
How to design a Bubble Chart? It’s very easy! All that you need is a powerful software. Never before creation of a Bubble Chart wasn’t so easy as now with tools of Bubble Diagrams Solution from the "Diagrams" Area for ConceptDraw Solution Park.Four Dimensions Bubble Plot
This sample was created in ConceptDraw DIAGRAM diagramming and vector drawing software using the Bubble Diagrams Solution from the "Diagrams" area of ConceptDraw Solution Park. This sample clearly shows the Four Dimensions Bubble Diagram of the distribution of chlorine contaminant in the water source. This Bubble Diagram is very useful in the chemistry, hydrology, and ecology.- How To Draw Table Plan By Software At Restaurant Video File
- Periodic Table Drawing On Chart
- Schedule pie chart - Daily action plan | Chart Maker for ...
- Venn Diagram Examples for Problem Solving. Venn Diagram as a ...
- Developing Entity Relationship Diagrams | Entity Relationship ...
- Draw The Periodic Table In Chemistry
- Atmosphere air composition | Percentage Pie Chart. Pie Chart ...
- IDEF0 Flowchart Symbols | Memory Drawing Lab
- Chart Examples | Bar Graph | Pie Graph Worksheets | Images Of Bar ...
- Restaurant Floor Plan Software | Table Seating Chart Template ...
- Composition Conversion Of Graphics Pie Chart Bar Chart Table
- Design elements - Periodic table of chemical elements | Chemistry ...
- Table Seating Chart Template | Restaurant Floor Plan Software ...
- Draw A Periodic Table On A Chart Paper
- Chemistry Drawing Software | Technical Flow Chart | How to Draw ...
- Sample Of A Restaurant Table Layouts
- Building Drawing Software for Design Seating Plan | Table Seating ...
- Chemistry Symbols and Meanings | Chemistry Drawing Software ...
- Chart Maker for Presentations | Percentage Pie Chart. Pie Chart ...
- Chemistry Drawings | Chemistry Drawing Software | Organic ...

