 Cross-Functional Flowcharts
Cross-functional flowcharts are powerful and useful tool for visualizing and analyzing complex business processes which requires involvement of multiple people, teams or even departments. They let clearly represent a sequence of the process steps, the order of operations, relationships between processes and responsible functional units (such as departments or positions).
 Logistics Flow Charts
Logistics Flow Charts solution extends ConceptDraw PRO v11 functionality with opportunities of powerful logistics management software. It provides large collection of predesigned vector logistic symbols, pictograms, objects and clipart to help you design with pleasure Logistics flow chart, Logistics process flow diagram, Inventory flow chart, Warehouse flowchart, Warehouse management flow chart, Inventory control flowchart, or any other Logistics diagram. Use this solution for logistics planning, to reflect logistics activities and processes of an enterprise or firm, to depict the company's supply chains, to demonstrate the ways of enhancing the economic stability on the market, to realize logistics reforms and effective products' promotion.
 Sales Flowcharts
The Sales Flowcharts solution lets you create and display sales process maps, sales process workflows, sales steps, the sales process, and anything else involving sales process management.
 Event-driven Process Chain Diagrams
Event-driven Process Chain (EPC) Diagram is a type of flowchart widely used for modeling in business engineering and reengineering, business process improvement, and analysis. EPC method was developed within the Architecture of Integrated Information Systems (ARIS) framework.
Food Court
Food courts are one of the most rapidly developing areas of the restaurant business. ConceptDraw PRO diagramming and vector drawing software offers a Food Court solution from the Food and Beverage area with wide capabilities for planning, design, developing and advertising of a Food Court.
 Security and Access Plans
This solution extends ConceptDraw PRO software with physical security plan, security chart, access chart, security plans, access schemes, access plans , CCTV System Plan samples, templates and libraries of design elements for drawing the Security and Acce
Flow Map
A Flow Map is a type of thinking maps which help easy organize and understand information. It consists of the set of boxes and arrows, and visually displays a sequence of events. ConceptDraw PRO diagramming and vector drawing software extended with Flowcharts Solution from the "What is a Diagram" Area of ConceptDraw Solution Park allows you to draw in a few minutes the Flow Map of any degree of complexity.Healthy Food Ideas
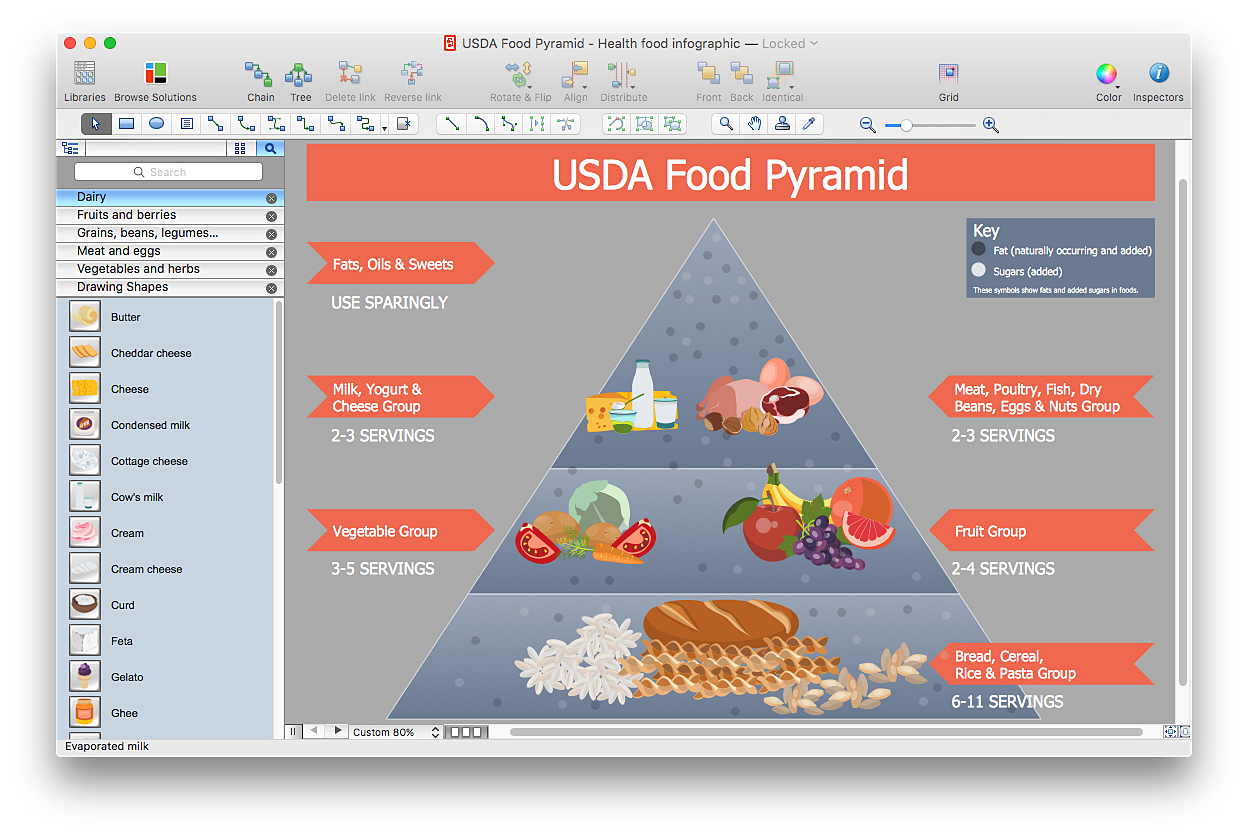
Representation of healthy food ideas and designing illustrations for healthy food recipes, decoration healthy diet plan and drawing healthy foods images has never been easier than now thanks to the ConceptDraw PRO diagramming and vector drawing software enhanced with Health Food solution from the Food and Beverage area of ConceptDraw Solution Park.Healthy Foods
Use of various charts, diagrams and infographics is the most effective way of visual presenting information about healthy foods, healthy eating and healthy diet. ConceptDraw PRO diagramming and vector drawing software offers the Health Food solution from the Food and Beverage area of ConceptDraw Solution Park which is overfull of powerful drawing tools, libraries with ready-to-use vector objects and clipart, predesigned samples and examples which will help you easy design healthy foods illustrations.
 Flowcharts
The Flowcharts Solution for ConceptDraw PRO v10 is a comprehensive set of examples and samples in several different color themes for professionals that need to graphically represent a process. Solution value is added by basic flow chart template and shapes' library of Flowchart notation. ConceptDraw PRO flow chart creator lets one depict a processes of any complexity and length, as well design of the flowchart either vertically or horizontally.
 Value Stream Mapping
Value stream mapping solution extends ConceptDraw PRO software with templates, samples and vector stencils for drawing the Value Stream Maps (VSM) in lean manufacturing practice.
HelpDesk
How to Create Infographics that Help People Eat Healthy
The most effective manner of presenting information on healthy diet and food nutrition is using various visualizations such as charts or infographics. To help easily create infographics and diagrams of healthy eating, ConceptDraw has provided the Health Food solution to its Solution Park. It contains vector stencil libraries of healthy eating options, samples of diagrams and infographics, and a set of templates to help you create your own diagrams, infographics and even adds. Using ConceptDraw PRO you can easily create and share healthy food recipes and materials about the proper nutrition.
 Food Court
Use the Food Court solution to create food art. Pictures of food can be designed using libraries of food images, fruit art and pictures of vegetables.
 Seven Basic Tools of Quality
Manage quality control in the workplace, using fishbone diagrams, flowcharts, Pareto charts and histograms, provided by the Seven Basic Tools of Quality solution.
- Flowchart Of Beverage Control Cycle
- Draw A Flow Chart Of Food And Beverage Control
- Flowchart Of Beverage Control
- Draw A Flow Chart For Food And Beverage Control
- Flowchart Of Food And Beverage Control
- Flow Chart For Production Of Beverages
- Draw A Flow Chart Of Beverages
- Draw And Explain Flowchart Of Food And Beverage Clearly System
- Draw A Flowchart Of Beverage
- Sample Of Pareto Chart In Food And Beverage
- Beverages Flowchart
- Draw A Flow Chart Of Beverage
- Ishikawa Diagram For Beverage Production
- Health Food | Flow Chart Of Nutrition With Example
- Draw A Chart Of Bevarage
- Food And Beverage Diagram
- Health Food | How To Draw Nutrition Food On A Chart
- Food and Beverage | Food Art | Fruit Art | Beverage Samples
- Health Food | Draw Nutrition Chart
- Fishbone Diagram For Production Of Beverages


