 Business Intelligence Dashboard
Business Intelligence Dashboard solution extends the ConceptDraw PRO v11 functionality with exclusive tools, numerous ready-to-use vector objects, samples and quick-start templates for creation professional Business Intelligence Dashboards, Business Intelligence Graphics, Business Intelligence Charts and Maps of different kinds. Design easy the BI dashboard, BI model or Dynamic chart in ConceptDraw PRO to monitor the company's work, to track the indicators corresponding your company's data, to display and analyze key performance indicators, to evaluate the trends and regularities of the processes occurring at the company.
HelpDesk
How to Make Business Intelligence Dashboard
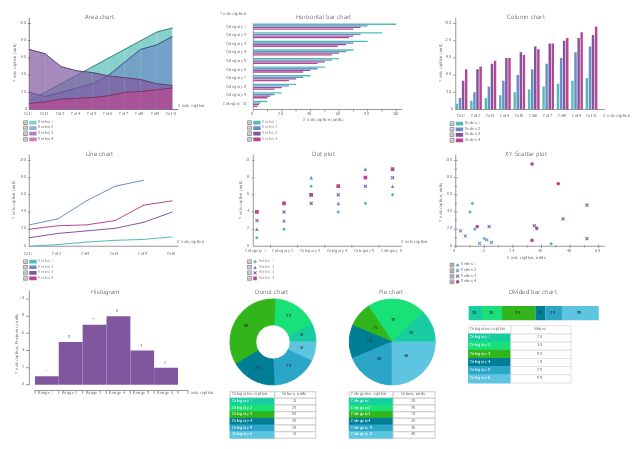
The business data represented in the view of dashboard can show the real picture of the activity of the entire organization, or it can display particular information like website effectiveness, call center statistics, and more business KPIs in the company. Dashboards provides managers, marketers, and analysts to quickly sort out the position of the company and to determine the weakest links. The dashboard helps to to compare easily different stages of business process and to accomplish the right decision. Business Intelligence Solution for ConceptDraw PRO makes for a powerful analytical tool that displays an organization’s processes and provides valuable competitive insight into business performance.The vector stencils library "BI charts" contains 10 graph templates.
Use it to visualize business metrics on your business intelligence dashboards in ConceptDraw PRO software.
"A chart can take a large variety of forms, however there are common features that provide the chart with its ability to extract meaning from data.
Typically the data in a chart is represented graphically, since humans are generally able to infer meaning from pictures quicker than from text. Text is generally used only to annotate the data." [Chart. Wikipedia]
The graph and chart templates example "Design elements - BI charts" is included in the Business Intelligence Dashboards solution from the Business Processes area of ConceptDraw Solution Park.
 Pie Charts
Pie Charts are extensively used in statistics and business for explaining data and work results, in mass media for comparison (i.e. to visualize the percentage for the parts of one total), and in many other fields. The Pie Charts solution for ConceptDraw PRO v10 offers powerful drawing tools, varied templates, samples, and a library of vector stencils for simple construction and design of Pie Charts, Donut Chart, and Pie Graph Worksheets.
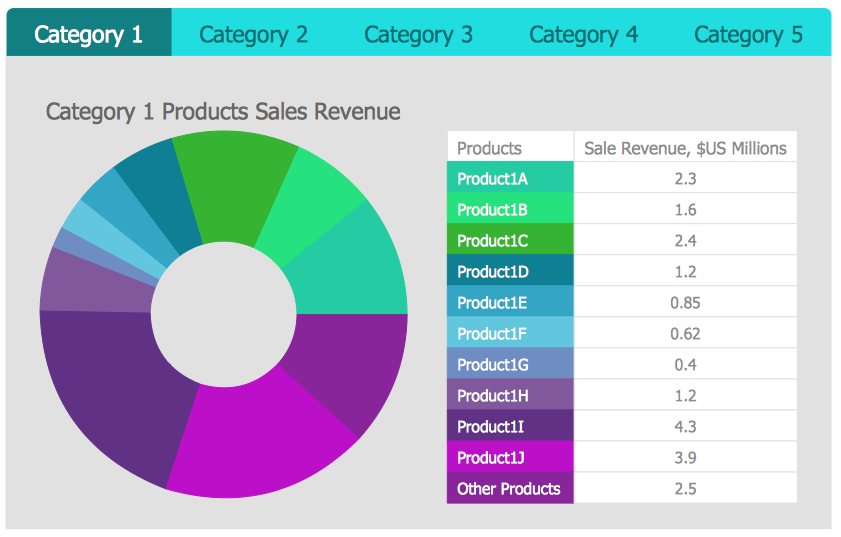
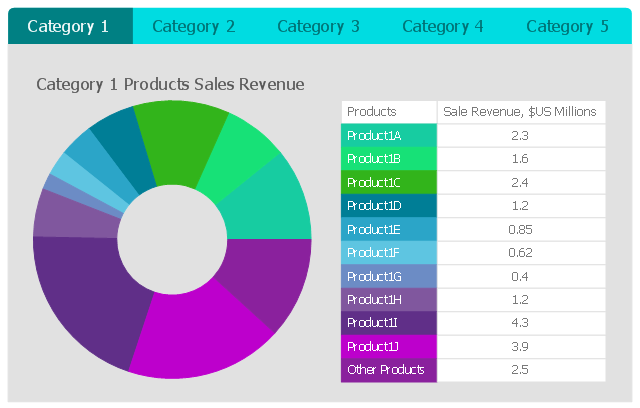
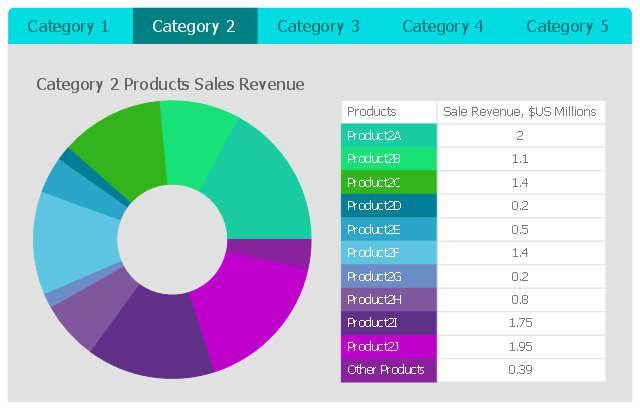
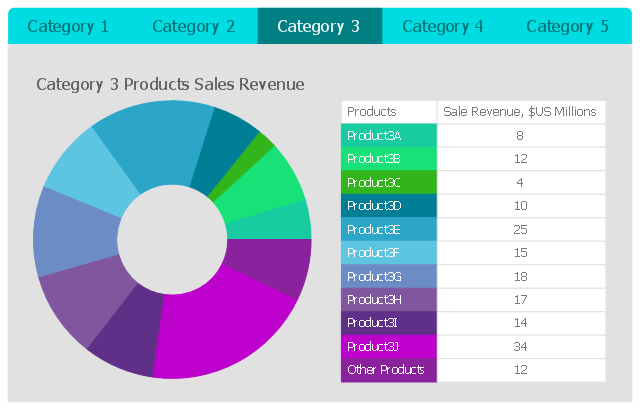
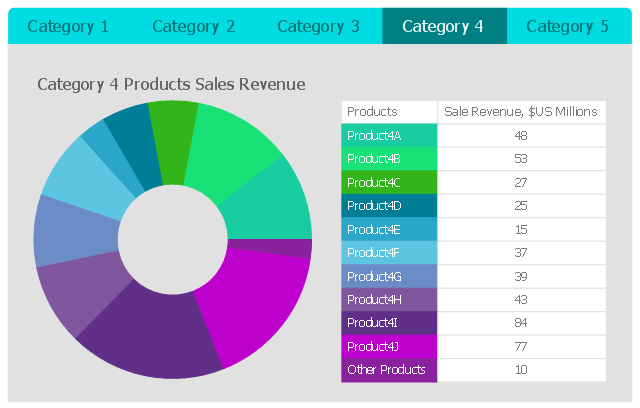
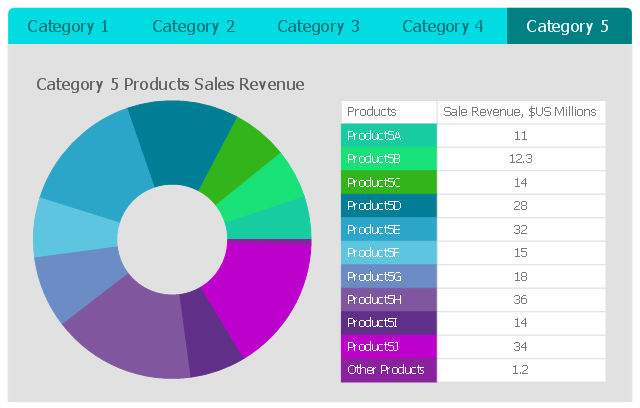
This business intelligence dashboard sample shows the quarter sales revenue for top 10 products by categories using donut charts.
"A doughnut chart (also spelled donut) is a variant of the pie chart, with a blank center allowing for additional information about the data as a whole to be included." [Pie chart. Wikipedia]
The BI dashboard example "Quarter Sales Revenue for Top 10 Products by Categories" was created using ConceptDraw PRO software extended with the Business Intelligence Dashboards solution from the Business Processes area of ConceptDraw Solution Park.
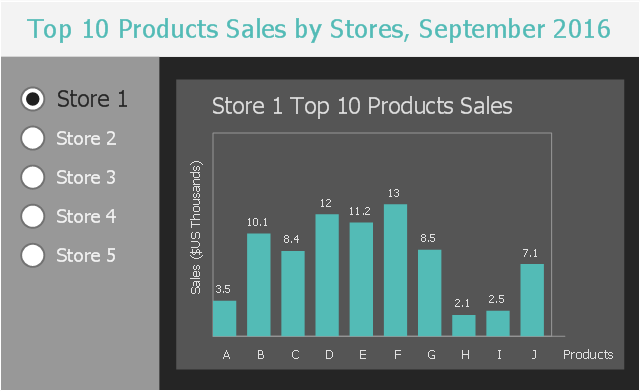
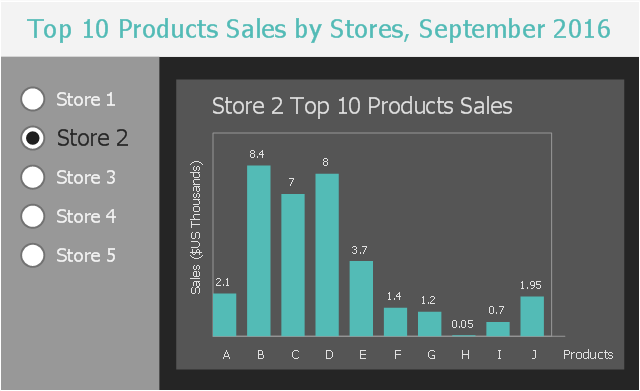
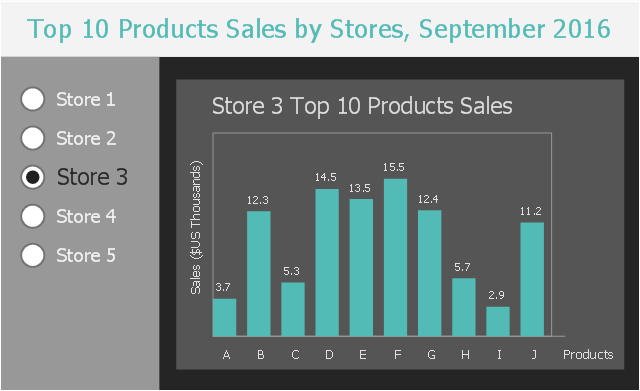
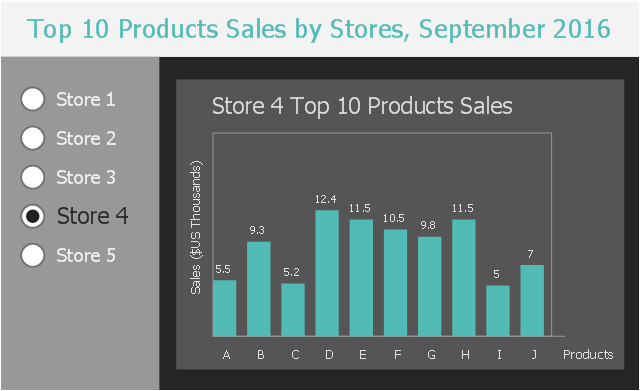
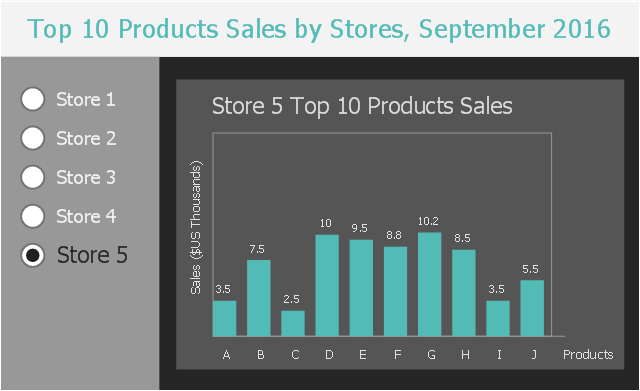
This business intelligence dashboard sample shows the top 10 products sales by stores in September, 2016 using vertical bar charts.
"Bar graphs/ charts provide a visual presentation of categorical data. Categorical data is a grouping of data into discrete groups, such as months of the year, age group, shoe sizes, and animals. These categories are usually qualitative. In a column bar chart, the categories appear along the horizontal axis; the height of the bar corresponds to the value of each category." [Bar chart. Wikipedia]
The BI dashboard example "Top 10 Products Sales by Stores, September 2016" was created using ConceptDraw PRO software extended with the Business Intelligence Dashboards solution from the Business Processes area of ConceptDraw Solution Park.
 AWS Architecture Diagrams
The flexible AWS cloud solutions will help you to create reliable applications with a high level of scaling in the AWS cloud, to run your applications and accelerate their work on the level of security. Besides AWS resources are available worldwide and yo
 Enterprise Architecture Diagrams
Enterprise Architecture Diagrams solution extends ConceptDraw PRO software with templates, samples and library of vector stencils for drawing the diagrams of enterprise architecture models.
 Circular Arrows Diagrams
Circular Arrows Diagrams solution extends ConceptDraw PRO v10 with extensive drawing tools, predesigned samples, Circular flow diagram template for quick start, and a library of ready circular arrow vector stencils for drawing Circular Arrow Diagrams, Segmented Cycle Diagrams, and Circular Flow Diagrams. The elements in this solution help managers, analysts, business advisers, marketing experts, scientists, lecturers, and other knowledge workers in their daily work.
- Basketball Top View Png
- Iphone 6 Screen Png
- Business Report Clipart Png
- Perfronace Line Chart Png
- Distribution Sales Representative Vector Png
- Dashboard Chart Png
- Dashboard Vector Png
- Seating Top View Png
- Bar Chart Examples | Bar Diagrams for Problem Solving. Create ...
- Png Table Top View
- Quarter Icon Png
- Top View Plants Png
- Top View Garden Png
- Top View Png Garden
- Frequency Distribution Dashboard | Create a Flow Chart ...
- Door Plan Png
- Map of median household income in Australia | Continent Maps ...
- New Business Intelligence Dashboard Solution for ConceptDraw PRO
- Triangle Frame Png
- Tables In School Top View
