 Biology
Biology solution extends ConceptDraw DIAGRAM software with samples, templates and libraries containing biological vector symbols, to help you create scientific and educational designs in the field of biology.
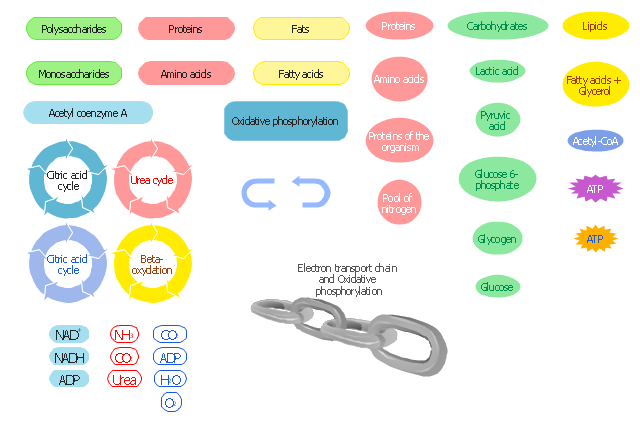
The vector stencils library " Biochemistry of metabolism" contains 46 metabolite symbols for drawing metabolic pathways maps, biochemical diagrams and metabolism process flow charts using the ConceptDraw PRO diagramming and vector drawing software.
"Metabolites are the intermediates and products of metabolism. The term metabolite is usually restricted to small molecules. Metabolites have various functions, including fuel, structure, signaling, stimulatory and inhibitory effects on enzymes, catalytic activity of their own (usually as a cofactor to an enzyme), defense, and interactions with other organisms (e.g. pigments, odorants, and pheromones). A primary metabolite is directly involved in normal "growth", development, and reproduction. Alcohol is an example of a primary metabolite produced in large-scale by industrial microbiology. A secondary metabolite is not directly involved in those processes, but usually has an important ecological function. Examples include antibiotics and pigments such as resins and terpenes etc. ...
The metabolome forms a large network of metabolic reactions, where outputs from one enzymatic chemical reaction are inputs to other chemical reactions." [Metabolite. Wikipedia]
The shapes example "Design elements - Biochemistry of metabolism" is included in the Biology solution from the Science and Education area of ConceptDraw Solution Park.
"In biochemistry, metabolic pathways are series of chemical reactions occurring within a cell. In each pathway, a principal chemical is modified by a series of chemical reactions. Enzymes catalyze these reactions, and often require dietary minerals, vitamins, and other cofactors in order to function properly. Because of the many chemicals (a.k.a. "metabolites") that may be involved, metabolic pathways can be quite elaborate. In addition, numerous distinct pathways co-exist within a cell. This collection of pathways is called the metabolic network. Pathways are important to the maintenance of homeostasis within an organism. Catabolic (break-down) and Anabolic (synthesis) pathways often work interdependently to create new biomolecules as the final end-products." [Metabolic pathway. Wikipedia]
The biochemical diagram example "Metabolic pathway map" was created using the ConceptDraw PRO diagramming and vector drawing software extended with the Biology solution from the Science and Education area of ConceptDraw Solution Park.
The biochemical diagram example "Metabolic pathway map" was created using the ConceptDraw PRO diagramming and vector drawing software extended with the Biology solution from the Science and Education area of ConceptDraw Solution Park.
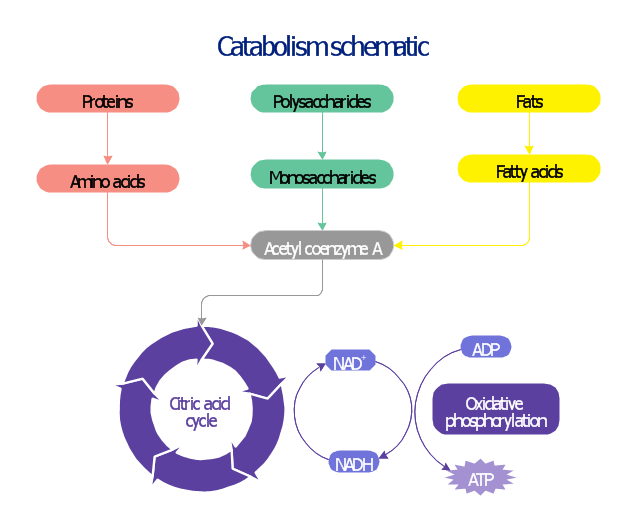
This biochemical chart display how proteins, polysaccharides and fats from food are digested into gastrointestinal tract into aminoacids, monosaccharides and fatty acids, and then broken down and oxidized to carbon dioxide and water in cellular processes of energy generation.
This metabolic pathway map was redesigned from Wikipedia file: Catabolism schematic.svg. [en.wikipedia.org/ wiki/ File:Catabolism_ schematic.svg]
The biochemical diagram example "Catabolism schematic" was created using the ConceptDraw PRO diagramming and vector drawing software extended with the Biology solution from the Science and Education area of ConceptDraw Solution Park.
Flowchart design. Flowchart symbols, shapes, stencils and icons
A flowchart is a type of diagram which represents an algorithm, process or workflow, displays the steps as boxes of various kinds and depicts their order by connecting them with arrows. Any business graphic document will be more colorful and understandable if will use professional-looking and visual diagrams and flowcharts. Flowchart design gives versatile presenting and explaining of the process. ConceptDraw DIAGRAM flowchart software enhanced with Flowcharts solution helps effectively make Flowchart Design. Use of predesigned flowchart symbols and bright color palette offers a fresh view and favorably distinguishes the flowcharts designed in ConceptDraw DIAGRAM from the black and white flowcharts on a paper. Preferably to use no more than three or four colors and apply identical for the same shape types. The best flowchart design can be achieved by starting with Flowchart template, or any of suitable ready examples or samples offered in ConceptDraw STORE, open one of them and enter the proper text into each Flowchart shape. Each symbol of the flowchart has a definition that can't be changed. This means that all flowcharts shapes can be grouped in according to their meaning. Users with ConceptDraw DIAGRAM flowchart software can style groups of symbols with close definitions by color sets chosen from complementary palette. Almost all workflows can be depicted as a flowchart. Colored diagrams are more light for perception of the certain information, this is part of flowchart design. Bright colors need to be used in the key points of Decision symbols, to focus attention on their importance for whole process flow.
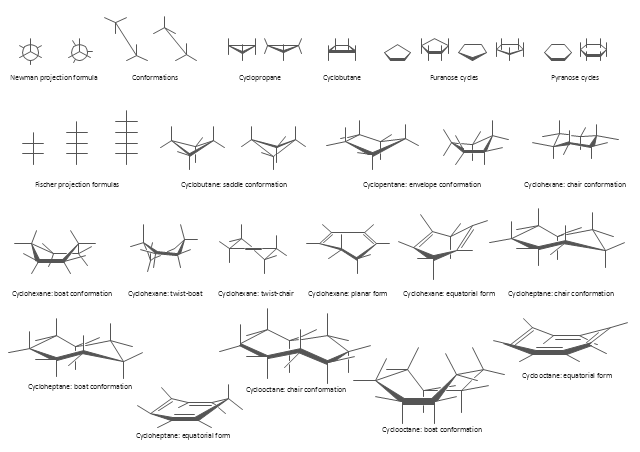
The vector stencils library "Conformations" contains 32 symbols of ring conformations, Newman and Fisher projections for chemical and biochemical drawing the molecular models and structural formulas of organic molecules and biochemical metabolites. It is useful in stereochemistry for drawing spatial structures of conformers of organic molecules, and schemes of stereospecific chemical reactions in organic synthesis.
"In chemistry, conformational isomerism is a form of stereoisomerism in which the isomers can be interconverted exclusively by rotations about formally single bonds (refer to figure on single bond rotation). Such isomers are generally referred to as conformational isomers or conformers and, specifically, as rotamers. Rotations about single bonds are restricted by a rotational energy barrier which must be overcome to interconvert one conformer to another. Conformational isomerism arises when the rotation about a single bond is relatively unhindered. That is, the energy barrier must be small enough for the interconversion to occur.
Conformational isomers are thus distinct from the other classes of stereoisomers (i. e. configurational isomers) where interconversion necessarily involves breaking and reforming of chemical bonds. For example, L- & D and R- & S- configurations of organic molecules have different handedness and optical activities, and can only be interconverted by breaking one or more bonds connected to the chiral atom and reforming a similar bond in a different direction or spatial orientation.
The study of the energetics between different rotamers is referred to as conformational analysis. It is useful for understanding the stability of different isomers, for example, by taking into account the spatial orientation and through-space interactions of substituents. In addition, conformational analysis can be used to predict and explain product(s) selectivity, mechanisms, and rates of reactions." [Conformational isomerism. Wikipedia]
The chemical symbols example "Design elements - Conformations" was created using the ConceptDraw PRO software extended with the Chemistry solution from the Science and Education area of ConceptDraw Solution Park.
 Healthcare Management Workflow Diagrams
Healthcare Management Workflow Diagrams solution contains large set of colorful samples and libraries with predesigned vector pictograms and symbols of health, healthcare equipment, medical instruments, pharmaceutical tools, transport, medication, departments of healthcare organizations, the medical icons of people and human anatomy, as well as the predesigned flowchart objects, connectors and arrows, which make it the best for designing clear and comprehensive Medi?al Workflow Diagrams and Block Diagrams, Healthcare Management Flowcharts and Infographics, Healthcare Workflow Diagram, for depicting the healthcare workflow and clinical workflows in healthcare, for making the workflow analysis healthcare and healthcare workflow management.
Biology Illustration
Biology solution offers 3 libraries of ready-to-use predesigned biology symbols and vector clipart to make your biology drawing and biology illustration making fast and easy: Carbohydrate Metabolism Library, Biochemistry of Metabolism Library, Citric Acid Cycle (TCA Cycle) Library.The vector stencils library "Citric acid cycle (TCA cycle)" contains 26 symbols of metabolites for drawing metabolic pathway maps and biochemical shematic diagrams of the citric acid cycle (TCA cycle, tricarboxylic acid cycle, Krebs cycle) and diagrams of metabolism processes.
"The citric acid cycle - also known as the tricarboxylic acid cycle (TCA cycle), or the Krebs cycle, - is a series of chemical reactions used by all aerobic organisms to generate energy through the oxidation of acetate derived from carbohydrates, fats and proteins into carbon dioxide and chemical energy in the form of adenosine triphosphate (ATP). In addition, the cycle provides precursors of certain amino acids as well as the reducing agent NADH that is used in numerous other biochemical reactions. Its central importance to many biochemical pathways suggests that it was one of the earliest established components of cellular metabolism and may have originated abiogenically.
The name of this metabolic pathway is derived from citric acid (a type of tricarboxylic acid) that is consumed and then regenerated by this sequence of reactions to complete the cycle. In addition, the cycle consumes acetate (in the form of acetyl-CoA) and water, reduces NAD+ to NADH, and produces carbon dioxide as a waste byproduct. The NADH generated by the TCA cycle is fed into the oxidative phosphorylation (electron transport) pathway. The net result of these two closely linked pathways is the oxidation of nutrients to produce usable chemical energy in the form of ATP." [Citric acid cycle. Wikipedia]
The shapes example "Design elements - TCA cycle" is included in the Biology solution from the Science and Education area of ConceptDraw Solution Park.
Settlement Process Flowchart. Flowchart Examples
Create your own flow charts of settlement processes using the ConceptDraw DIAGRAM diagramming and vector drawing software extended with the Cross-Functional Flowcharts solution from the Business Processes area of ConceptDraw Solution Park. Download easy flowchart software to create settlement process flowcharts show steps of monthly settlement with your business quickly and easily.- Metabolic pathway map - Biochemical diagram | Metabolic pathway ...
- Glucose catabolism pathways map | Biology | Catabolism schematic ...
- ATM Network. Computer and Network Examples | Biochemistry ...
- Metabolic pathway map - Biochemical diagram | Design elements ...
- Biology | Metabolic pathway map - Biochemical diagram | Sketch ...
- Catabolism schematic - Biochemical diagram | Biology | Design ...
- Metabolic pathway map - Biochemical diagram | Biology | Drawing ...
- Metabolic pathway map - Biochemical diagram | Biology | Design ...
- Design elements - Biochemistry of metabolism | Metabolic pathway ...
- Flow Diagram Of Biochemical Engineering Application In Food And


-symbols--design-elements---tca-cycle.png--diagram-flowchart-example.png)
