 Biology
Biology solution extends ConceptDraw PRO software with samples, templates and libraries containing biological vector symbols, to help you create scientific and educational designs in the field of biology.
Biology Illustration
Biology solution offers 3 libraries of ready-to-use predesigned biology symbols and vector clipart to make your biology drawing and biology illustration making fast and easy: Carbohydrate Metabolism Library, Biochemistry of Metabolism Library, Citric Acid Cycle (TCA Cycle) Library.HelpDesk
How to Draw Biology Diagram
Biology is the science studying the living forms of life. A good starting point when studying biology is to use drawings. Drawings help students to comprehend and remember knowledge that is difficult to explain and understand. Students are used to draw various specific diagrams such as the human circulatory systems or schemes of various biochemical processes. Researchers also need to complete their work with a variety of related diagrams and illustrations. ConceptDraw Biology solution allows you to draw various biological diagrams and schemes easily.Biology Drawing Software
Biology is incredibly interesting and useful natural science which studies all living things on the earth (people, animals, plants), structure, functions, interactions, evolution of living organisms. Biologists of the whole world use actively illustrations and drawings in your science and education activity. To facilitate their task of biology drawing, ConceptDraw PRO diagramming and vector drawing software was extended with Biology solution from the Science and Education area. Now, ConceptDraw PRO is a powerful biology drawing software.Network Community Structure. Computer and Network Examples
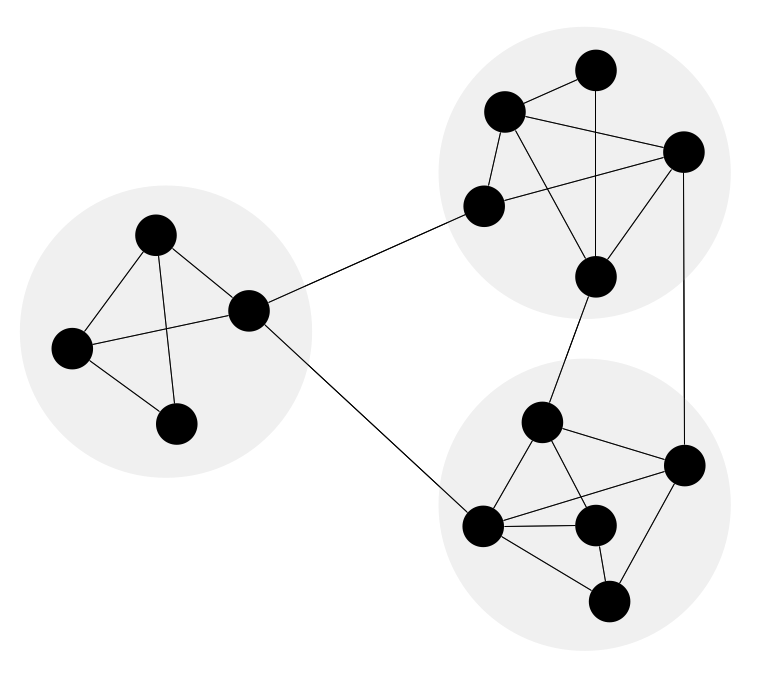
Network community structure is a network which nodes can be easily grouped into the sets of nodes with dense internally connections. This example shows a network that displays the community structure with three groups of nodes with dense internal connections and sparser connections between the groups.
Process Flowchart
The main reason of using Process Flowchart or PFD is to show relations between major parts of the system. Process Flowcharts are used in process engineering and chemical industry where there is a requirement of depicting relationships between major components only and not include minor parts. Process Flowcharts for single unit or multiple units differ in their structure and implementation. ConceptDraw PRO is Professional business process mapping software for making Process flowcharts, Process flow diagram, Workflow diagram, flowcharts and technical illustrations for business documents and also comprehensive visio for mac application. Easier define and document basic work and data flows, financial, production and quality management processes to increase efficiency of your business with ConcepDraw PRO. Business process mapping software with Flowchart Maker ConceptDraw PRO includes extensive drawing tools, rich examples and templates, process flowchart symbols and shape libraries, smart connectors that allow you create the flowcharts of complex processes, process flow diagrams, procedures and information exchange. Process Flowchart Solution is project management workflow tools which is part ConceptDraw Project marketing project management software. Drawing charts, diagrams, and network layouts has long been the monopoly of Microsoft Visio, making Mac users to struggle when needing such visio alternative like visio for mac, it requires only to view features, make a minor edit to, or print a diagram or chart. Thankfully to MS Visio alternative like ConceptDraw PRO software, this is cross-platform charting and business process management tool, now visio alternative for making sort of visio diagram is not a problem anymore however many people still name it business process visio tools.
Basic Diagramming Flowchart Software
ConceptDraw PRO is a powerful intelligent vector graphics tool for drawing flowcharts.Biology Drawing
It is impossible to imagine the biology science without drawings. Drawings are very convenient way to explain the different biological knowledge and processes. If you dream to design any biology drawing quick and easy – the ConceptDraw PRO software is exactly what you need. ConceptDraw PRO diagramming and vector drawing software extended with Biology solution from the Science and Education area offers the useful tools for easy biology drawing.Biology Symbols
ConceptDraw PRO diagramming and vector drawing software extended with Biology solution from the Science and Education area offers a set of useful tools for fast and easy drawing of various biology illustrations and drawings.Biology solution provides 3 libraries with large quantity of vector biology symbols: Biochemistry of Metabolism Library, Carbohydrate Metabolism Library, Citric Acid Cycle (TCA Cycle) Library.
HelpDesk
How to Draw a Circular Arrows Diagram Using ConceptDraw PRO
The cyclic recurrence is a fundamental property of multiple systems. The cycle is a process which consists from elements (phases, stages, stages) following each other. Many processes in astronomy, biology, chemistry, physics, mathematics, etc. have a cycle properties. It is also widely used in information technologies and marketing analysis. Graphical representation of cyclic processes can have many forms. It can be a circle, parabola, hyperbola, ellipse and others. A Circular Arrows Diagram is used as one of the statistical charts in the business, mass media and marketing. ConceptDraw PRO provides its users tools for making easy drawing Circular Arrows Diagrams.Chemistry Drawing Software
ConceptDraw PRO extended with Chemistry solution from the Science and Education area is a powerful chemistry drawing software that provides the useful tools to help you design all kinds of chemistry drawings and illustrations, chemical schemes and diagrams of formulas, reaction schemes and lab set-ups of any complexity.
 PM Dashboards
The PM Dashboards solution extends the management boundaries of ConceptDraw PRO and ConceptDraw PROJECT products with an ability to demonstrate changes to the budget status, to show the project progress toward its objectives, to display clearly the identified key performance indicator (KPI) or the set of key performance indicators for any project. This solution provides you with examples and ability to generate three types of visual dashboards reports based on your project data Project Dashboard, Tactical Dashboard, and Radar Chart. By dynamically charting the project’s key performance indicators that are collected on one ConceptDraw PRO document page, all project participants, project managers, team members, team leaders, stakeholders, and the entire organizations, for which this solution is intended, have access to the daily status of projects they are involved in.
Chemistry Equation Symbols
If you are related with chemistry in you work or education activity, you need often draw various illustrations with chemistry equations. ConceptDraw PRO diagramming and vector drawing software offers you the Chemistry solution from the Science and Education area. Chemistry solution provides the Chemical Drawings Library with large quantity of vector chemistry equation symbols to help you create professional looking chemistry diagrams quick and easy.- Biology Projects Or Diagrams How To Draw Easily
- Biology Project Diagram
- Timeline Diagrams | ConceptDraw Solution Park | Biology | Diagram ...
- Biology Projects With Diagram
- Biology Project Drawing
- Biology Drawing Project
- How to Draw Biology Diagram in ConceptDraw PRO | Biology ...
- Basic Flowchart Symbols and Meaning | Timeline Diagrams | The ...
- Best Chart Making Project On Biology
- Mind Map Exchange | How to Draw Biology Diagram in ...
- Sample Diagrams In Science Project
- Biology Drawing Software | How to Draw Biology Diagram in ...
- Fishbone Diagram | Fishbone Diagrams | Biology | Fishbone ...
- Process Flowchart | Top 5 Android Flow Chart Apps | Emergency ...
- Innovative Chart For Biology
- HVAC Plans | Biology | Target and Circular Diagrams | Draw Energy ...
- Draw Ven Diagram Of Science Math Biology
- Bio Flowchart Lite | Biology Drawing Software | Top 5 Android Flow ...
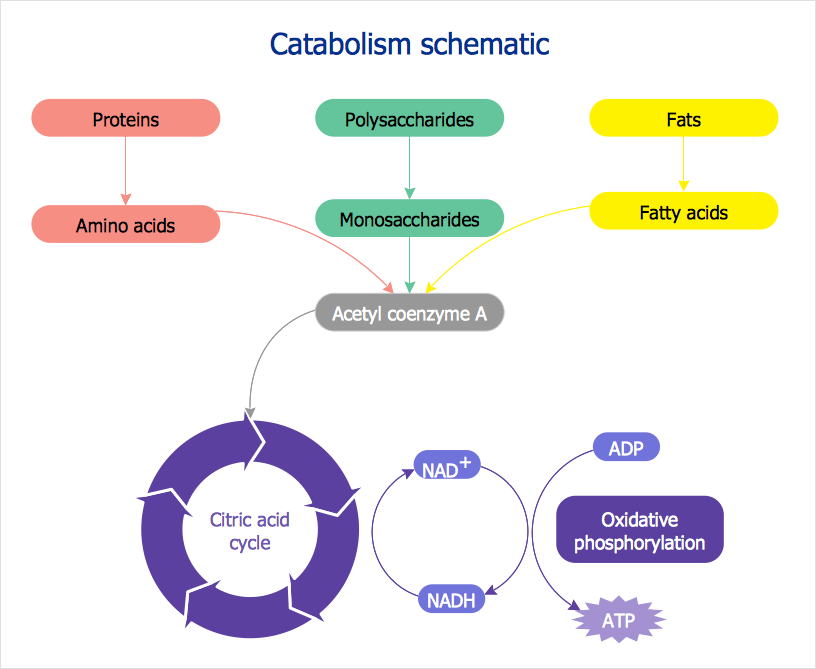
- Biology Drawing Software | Catabolism schematic - Biochemical ...
- How To Prepare Flow Charts For Biology


