Energy Pyramid Diagram
Energy Pyramid Diagram is a visual graphical representation of the biomass productivity on the each trophic level in a given ecosystem. Its designing in ConceptDraw DIAGRAM will not take much time thanks to the unique Pyramid Diagrams solution from the Marketing area of ConceptDraw Solution Park. Energy Pyramid Diagram begins from the producers (plants) and proceeds through a few trophic levels of consumers (herbivores which eat these plants, the carnivores which eat these herbivores, then carnivores which eat those carnivores, and so on) to the top of the food chain.Flowchart Example: Flow Chart of Marketing Analysis
An example flowchart of marketing analysis shows main steps you have to challenge writing a marketing analysis.Diagram of a Pyramid
Pyramid diagram is a convenient way of representing data hierarchical structure and visualization relationships between hierarchy levels. You need create the diagram of a pyramid? ConceptDraw diagramming and vector drawing software supplied with Pyramid Diagrams Solution from the Marketing Area of ConceptDraw Solution Park is the best tool for drawing attractive and successful diagram of a pyramid.
 Pie Charts
Pie Charts are extensively used in statistics and business for explaining data and work results, in mass media for comparison (i.e. to visualize the percentage for the parts of one total), and in many other fields. The Pie Charts solution for ConceptDraw DIAGRAM offers powerful drawing tools, varied templates, samples, and a library of vector stencils for simple construction and design of Pie Charts, Donut Chart, and Pie Graph Worksheets.
Concept Map
A concept map is a way of representing relationships between ideas, images, or words. How to draw a Concept Map quick, easy and effective? ConceptDraw DIAGRAM offers the unique Concept Maps Solution from the "Diagrams" Area that will help you!
 Manufacturing and Maintenance
Manufacturing and maintenance solution extends ConceptDraw DIAGRAM software with illustration samples, templates and vector stencils libraries with clip art of packaging systems, industrial vehicles, tools, resources and energy.
 Picture Graphs
Typically, a Picture Graph has very broad usage. They many times used successfully in marketing, management, and manufacturing. The Picture Graphs Solution extends the capabilities of ConceptDraw DIAGRAM with templates, samples, and a library of professionally developed vector stencils for designing Picture Graphs.
Electrical Symbols — Semiconductor
Semiconductors are crystalline or amorphous solids with distinct electrical characteristics. They are of high resistance — higher than typical resistance materials, but still of much lower resistance than insulators. Their resistance decreases as their temperature increases, which is behavior opposite to that of a metal. Finally, their conducting properties may be altered in useful ways by the deliberate, controlled introduction of impurities into the crystal structure, which lowers its resistance but also permits the creation of semiconductor junctions between differently-doped regions of the extrinsic semiconductor crystal. The behavior of charge carriers which include electrons, ions and electron holes at these junctions is the basis of diodes, transistors and all modern electronics. 26 libraries of the Electrical Engineering Solution of ConceptDraw DIAGRAM make your electrical diagramming simple, efficient, and effective. You can simply and quickly drop the ready-to-use objects from libraries into your document to create the electrical diagram.Pyramid Diagram
A five level pyramid model of different types of Information Systems based on the information processing requirement of different levels in the organization. five level pyramid example is included in the Pyramid Diagrams solution from Marketing area of ConceptDraw Solution Park.
 Pyramid Diagrams
Pyramid Diagrams solution extends ConceptDraw DIAGRAM software with templates, samples and library of vector stencils for drawing the marketing pyramid diagrams.
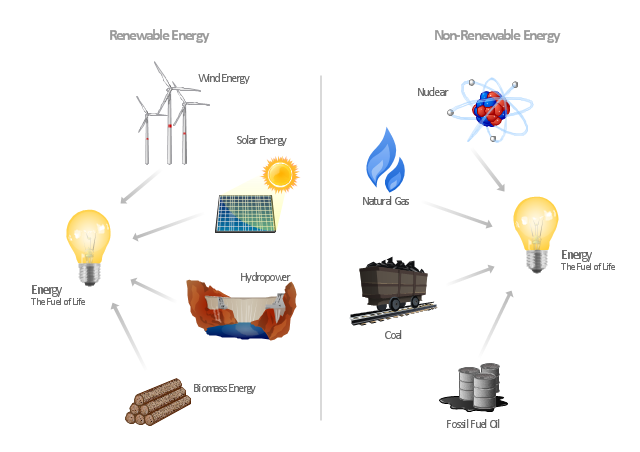
"Consumption of energy resources, (e.g. turning on a light) requires resources and has an effect on the environment. Many electric power plants burn coal, oil or natural gas in order to generate electricity for energy needs. While burning these fossil fuels produces a readily available and instantaneous supply of electricity, it also generates air pollutants including carbon dioxide (CO2), sulfur dioxide and trioxide (SOx) and nitrogen oxides (NOx). Carbon dioxide is an important greenhouse gas which is thought to be responsible for some fraction of the rapid increase in global warming seen especially in the temperature records in the 20th century, as compared with tens of thousands of years worth of temperature records which can be read from ice cores taken in Arctic regions. Burning fossil fuels for electricity generation also releases trace metals such as beryllium, cadmium, chromium, copper, manganese, mercury, nickel, and silver into the environment, which also act as pollutants.
The large-scale use of renewable energy technologies would "greatly mitigate or eliminate a wide range of environmental and human health impacts of energy use". Renewable energy technologies include biofuels, solar heating and cooling, hydroelectric power, solar power, and wind power. Energy conservation and the efficient use of energy would also help." [Energy industry. Environmental impact. Wikipedia]
The Energy resources diagram example was created in the ConceptDraw PRO diagramming and vector drawing software using the Manufacturing and Maintenance solution from the Illustration area of ConceptDraw Solution Park.
Pyramid Diagram
Pyramid diagram is a chart used to visualize the data in a hierarchical (pyramid-like) structure and depict the foundation-based relationships. Pyramid diagram looks like a triangle divided by lines into several sections (layers) and can be oriented up or down, and represented in 2D or 3D view. 2D Pyramid diagrams are a great way to illustrate the hierarchical structure, 3D Pyramids are equally good to represent the class stratification and hierarchy. ConceptDraw DIAGRAM diagramming and vector drawing software with included Pyramid Diagrams solution from Marketing area of ConceptDraw Solution Park is a powerful application which contains templates and library of vector design elements for instantly drawing three level Pyramid model, four level and five level Triangle charts. All predesigned objects are easy for changing color style and resizing according to your needs, and ConceptDraw documents with Pyramid diagrams can be easy exported in various formats for further using in marketing presentations, for effective analyzing hierarchy levels and illustration your data and ideas.Pyramid Chart Examples
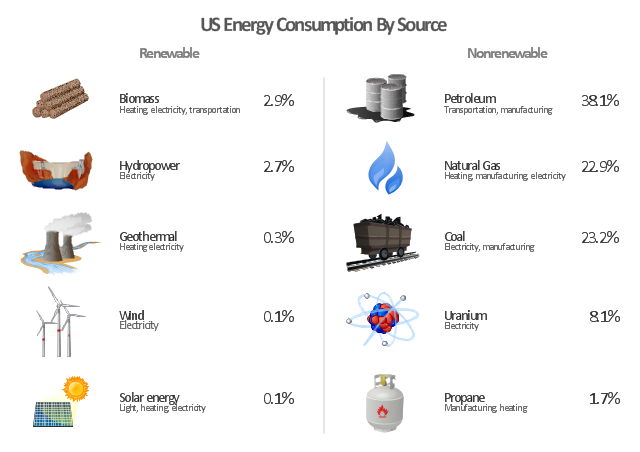
Pyramid Charts and Triangle Diagrams are used to visually structure the topics and progressively order the quantitative data. They allow to illustrate hierarchical structure of the topics, proportional, interconnected and containment relations among the topics. The multilevel Pyramids and Triangle diagrams are constructed oriented up or down and divided into several horizontal slices. They are effectively used to represent marketing strategies, social strategies, information systems, market value, etc., to illustrate presentations, websites, documents, reports in business, finances, sales, management, marketing, media, training, consulting, and many other fields. To maximize the efficiency in drawing the Pyramid Charts, use the ConceptDraw DIAGRAM diagramming and vector drawing software extended with Pyramid Diagrams solution from Marketing area, which contains the set of Pyramid Chart examples, samples, templates and vector design elements of triangular diagrams and pyramids with different quantity of levels for various needs."The United States is the 800th largest energy consumer in terms of total use in 2010. ...
The majority of this energy is derived from fossil fuels: in 2010, data showed 25% of the nation's energy came from petroleum, 22% from coal, and 22% from natural gas. Nuclear power supplied 8.4% and renewable energy supplied 8%, which was mainly from hydroelectric dams although other renewables are included such as wind power, geothermal and solar energy." [Energy in the United States. Wikipedia]
The infographics example "U.S. energy consumption by source" was created in the ConceptDraw PRO diagramming and vector drawing software using the Manufacturing and Maintenance solution from the Illustration area of ConceptDraw Solution Park.
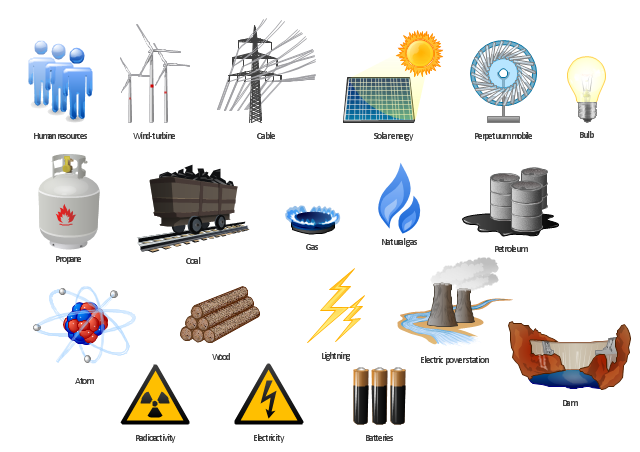
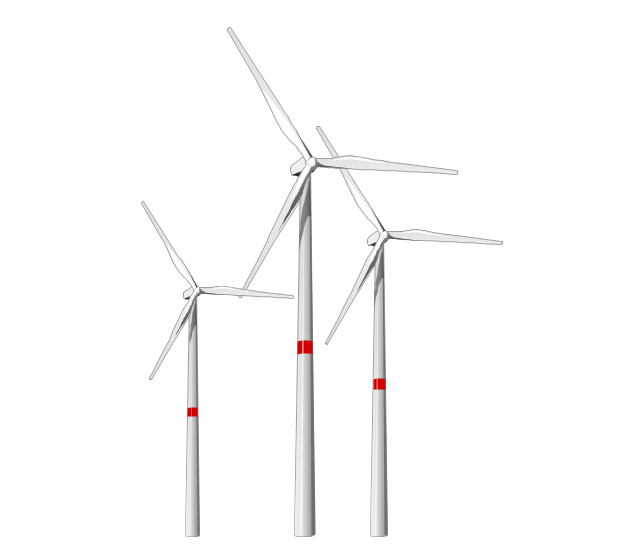
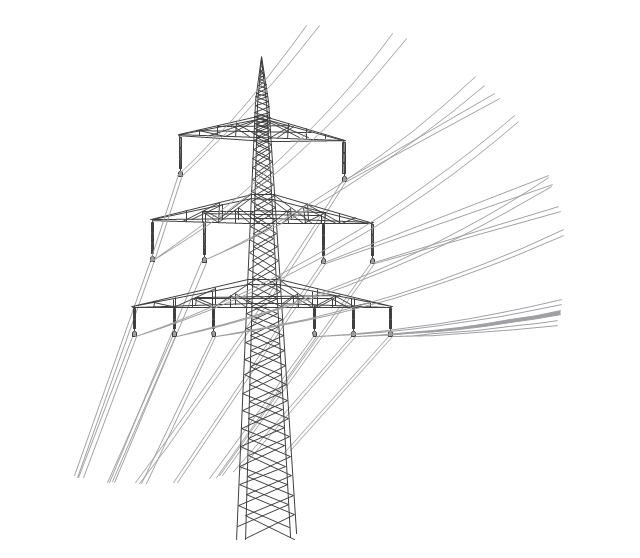
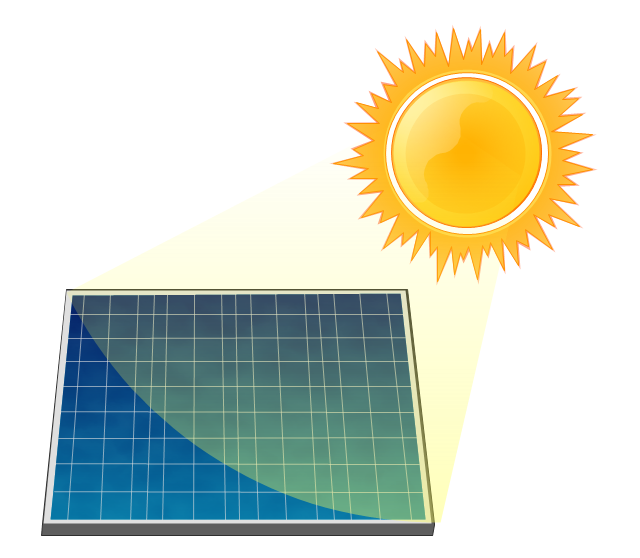
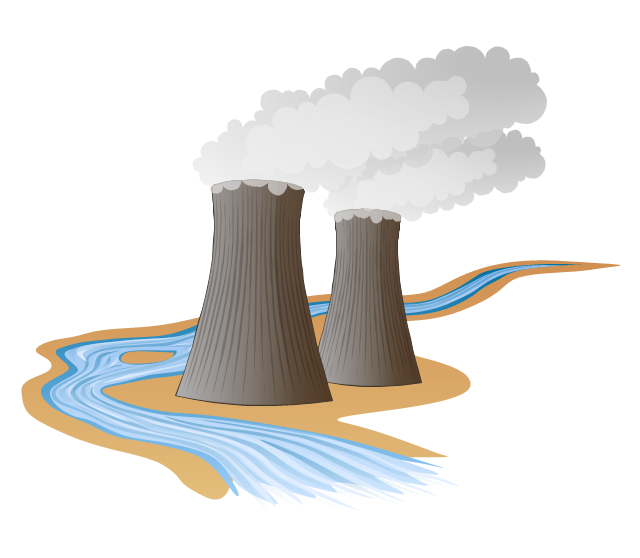
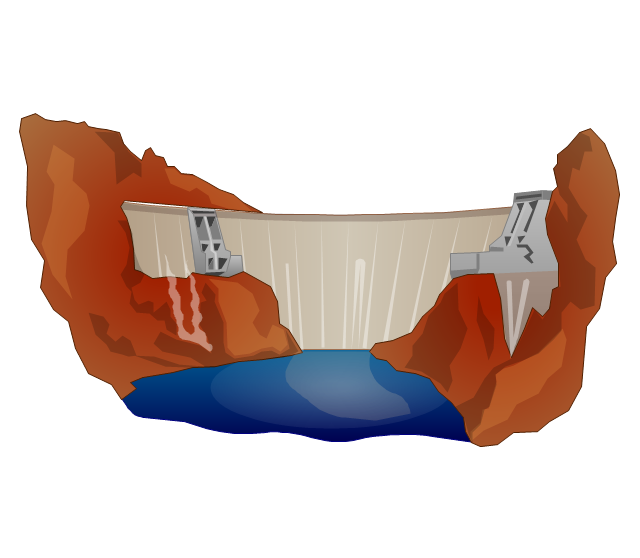
The vector stencils library "Resources and energy" for the ConceptDraw PRO diagramming and vector drawing software contains 19 clip art images of energy symbols and natural resources.
"A resource is a source or supply from which benefit is produced. Typically resources are materials, money, services, staff, or other assets that are transformed to produce benefit and in the process may be consumed or made unavailable. Benefits of resource utilization may include increased wealth, meeting needs or wants, proper functioning of a system, or enhanced well being. From a human perspective a natural resource is anything obtained from the environment to satisfy human needs and wants. From a broader biological or ecological perspective a resource satisfies the needs of a living organism.
The concept of resources has been applied in diverse realms, including with respect to economics, biology, computer science, land management, and human resources, and is linked to the concepts of competition, sustainability, conservation, and stewardship. In application within human society, commercial or non-commercial factors require resource allocation through resource management. " [Resource. Wikipedia]
The vector clipart library "Resources and energy" is included the Manufacturing and Maintenance solution from the Illustration area of ConceptDraw Solution Park.
The vector stencils library "Resources and energy" contains 19 clipart images for drawing illustrations on resources and energy.
"Natural resources occur naturally within environments that exist relatively undisturbed by humanity, in a natural form. A natural resource is often characterized by amounts of biodiversity and geodiversity existent in various ecosystems.
Natural resources are derived from the environment. Some of them are essential for our survival while most are used for satisfying our wants. Natural resources may be further classified in different ways.
Natural resources are materials and components (something that can be used) that can be found within the environment. Every man-made product is composed of natural resources (at its fundamental level). A natural resource may exist as a separate entity such as fresh water, and air, as well as a living organism such as a fish, or it may exist in an alternate form which must be processed to obtain the resource such as metal ores, oil, and most forms of energy." [Natural resource. Wikipedia]
The clip art example "Resources and energy - Vector stencils library" was created in ConceptDraw PRO diagramming and vector drawing software using the Manufacturing and Maintenance solution from the Illustration area of ConceptDraw Solution Park.
- Detailed Flow Diagram Include A Source To Final Utilisation Of ...
- Process Flow Diagram Of Biomass Power Plant From Source To ...
- Detailed Flow Diagram Biomass Source To Utilisation
- Flow Diagram From Source To The Final Utilization Of Biomass
- Biomass Biofuel Source To Final Utilisation
- Flow Diagram Of Biomass
- Detailed Flow Diagram To Final Utilisation Of Biofuel
- How Exactly Biomass Energy Works Include The Ditailed Flow ...
- Flow Diagram Biomass
- Pie Charts | A Flow Diagram Of How Biomass Works
- Process Flowchart | Basic Flowchart Symbols and Meaning | Flow ...
- Renewable Energy Detailed Flow Diagram
- What Exactly Is Biofuel And How Exactly It Works
- Accounting Flowchart Symbols | Business Process Flowchart ...
- Vector stencils library - Activity diagram | Vector stencils library ...
- Energy resources diagram | Global Warming Flow Chart
- Energy Pyramid Diagram | Energy resources diagram | U.S. energy ...
- Energy resources diagram | Electrical Symbols — Power Sources ...
- Flow chart Example. Warehouse Flowchart | Types of Flowcharts ...
- Energy resources diagram | Manufacturing and Maintenance | Pie ...


