 Pie Charts
Pie Charts are extensively used in statistics and business for explaining data and work results, in mass media for comparison (i.e. to visualize the percentage for the parts of one total), and in many other fields. The Pie Charts solution for ConceptDraw PRO v10 offers powerful drawing tools, varied templates, samples, and a library of vector stencils for simple construction and design of Pie Charts, Donut Chart, and Pie Graph Worksheets.
Blank Calendar Template
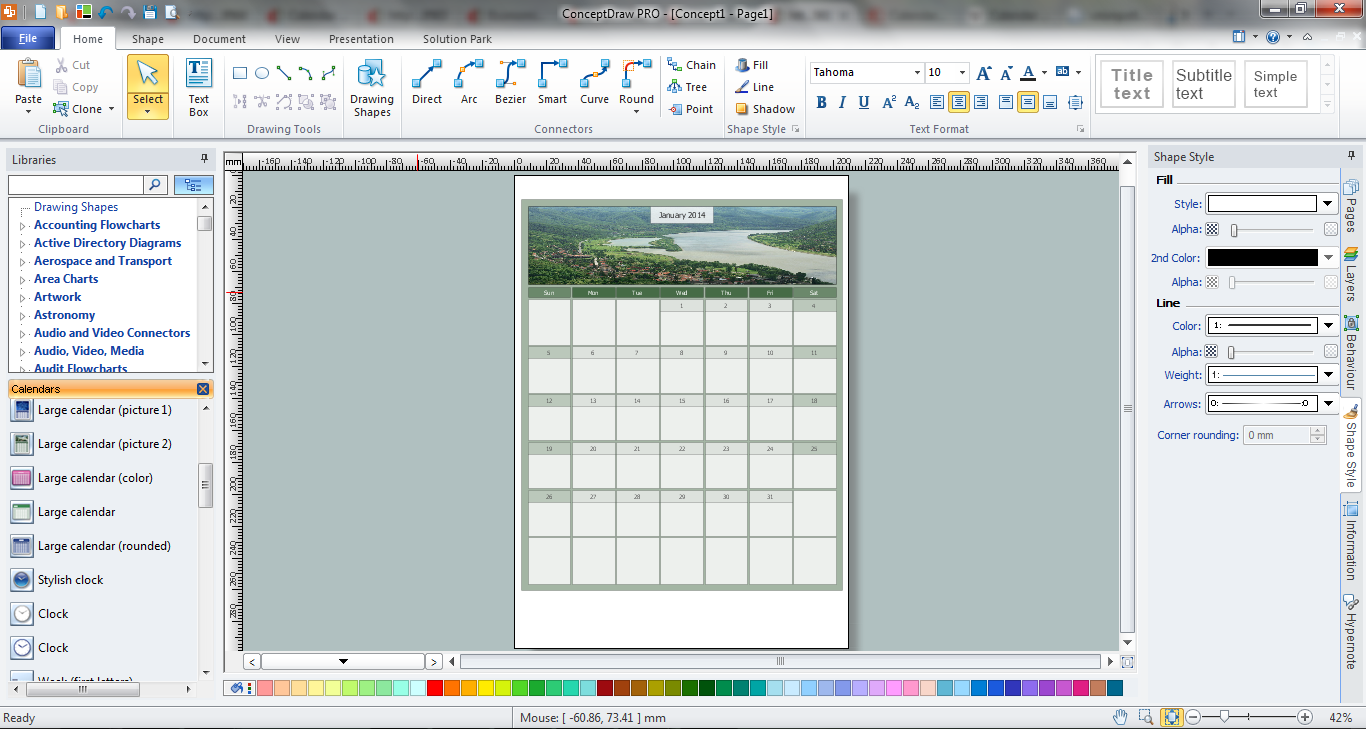
The calendars around us everywhere in the modern world. There are a lot of calendar types, each of them has its own assignment: Business calendar, Personal calendar, Economic calendar, Financial calendar, Daily calendar, Monthly calendar, and many other useful calendar types. ConceptDraw PRO offers you the possibility to make your own unique calendars on the base of the Blank Calendar Template which is included to the Calendars Solution from the Management Area.Scatter Graph Charting Software
ConceptDraw provides some interactive xy chart and scatter graph symbols that offers advanced features yet is simple to use.Blank Scatter Plot
This sample shows the Scatter Plot without missing categories. It’s very important to no miss the data, because this can have the grave negative consequences. The data on the Scatter Chart are represented as points with two values of variables in the Cartesian coordinates. This sample can be used in the engineering, business, statistics, analytics, at the creating the financial and other types of reports.Pie Chart Examples and Templates
A pie chart or a circle graph is a circular chart divided into sectors, illustrating numerical proportion. In a pie chart, the arc length of each sector and consequently its central angle and area, is proportional to the quantity it represents. Pie chart examples and templates created using ConceptDraw PRO software helps you get closer with pie charts and find pie chart examples suite your needs.Scatter Graph
You've got to draw the Scatter Graph and look for the convenient tool which will help you? Direct your attention on the ConceptDraw PRO diagramming and vector drawing software extended with Scatter Diagrams Solution from the Graphs and Charts Area.Percentage Spider Chart
ConceptDraw PRO creates drawings, diagrams and charts with great visual appeal in Mac OS X. This sample shows the Spider Chart that represents the buyer perceptions of the leather footwear industries in Brazil, India and Italy.Pyramid Diagram
ConceptDraw Pyramid Diagram software allows drawing column charts using predesigned objects or drawing tools.Blank Calendar
Milliard of people every day use the calendars which around us everywhere. For their creating designers apply large efforts, and also all their fantasy to make them attractive. Now we are glad to offer you the effective drawing tool - Calendars Solution from the Management Area for ConceptDraw Solution Park which contains the ready-to-use Blank Calendar shapes.Donut Chart Templates
These donut chart templates was designed using ConceptDraw PRO diagramming and vector drawing software extended with Pie Charts solution from Graphs and Charts area of ConceptDraw Solution Park. All these donut chart templates are included in the Pie Charts solution. You can quickly rework these examples into your own charts by simply changing displayed data, title and legend texts.How Do You Make a Histogram?
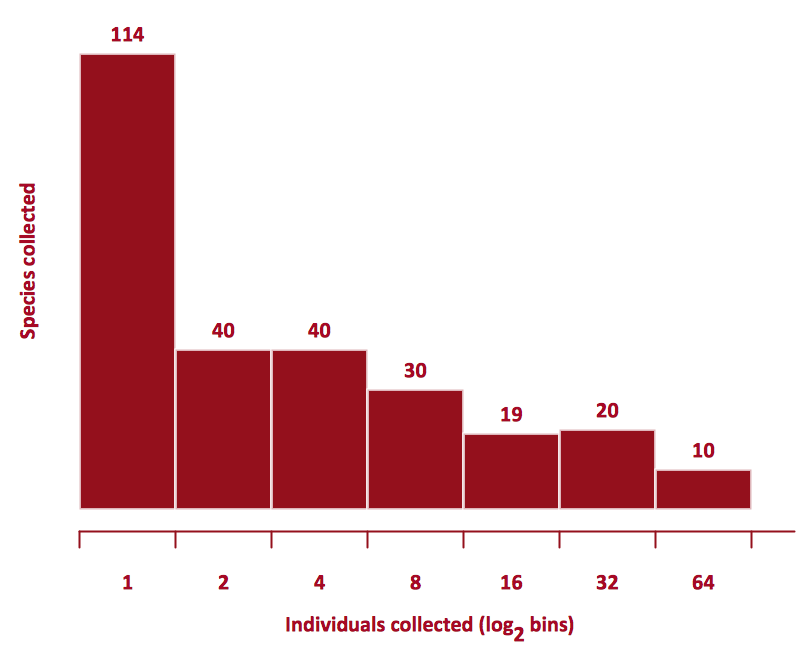
How do you make a histogram usually? Drawing of histogram is quite complex and lengthy process. Usually you have a set of data and you draw free-hand your diagram according to these data. But now thanks to the ConceptDraw PRO diagramming and vector drawing software extended with Histograms solution from the Graphs and Charts Area of ConceptDraw Solution Park this process became simple and fast.Marketing Plan Infographic
You need design the Marketing Plan Infographic and dream to find the useful tools to draw it easier, quickly and effectively? ConceptDraw PRO offers the unique Marketing Infographics Solution from the Business Infographics Area that will help you!Scatter Chart Analysis. Scatter Chart Example
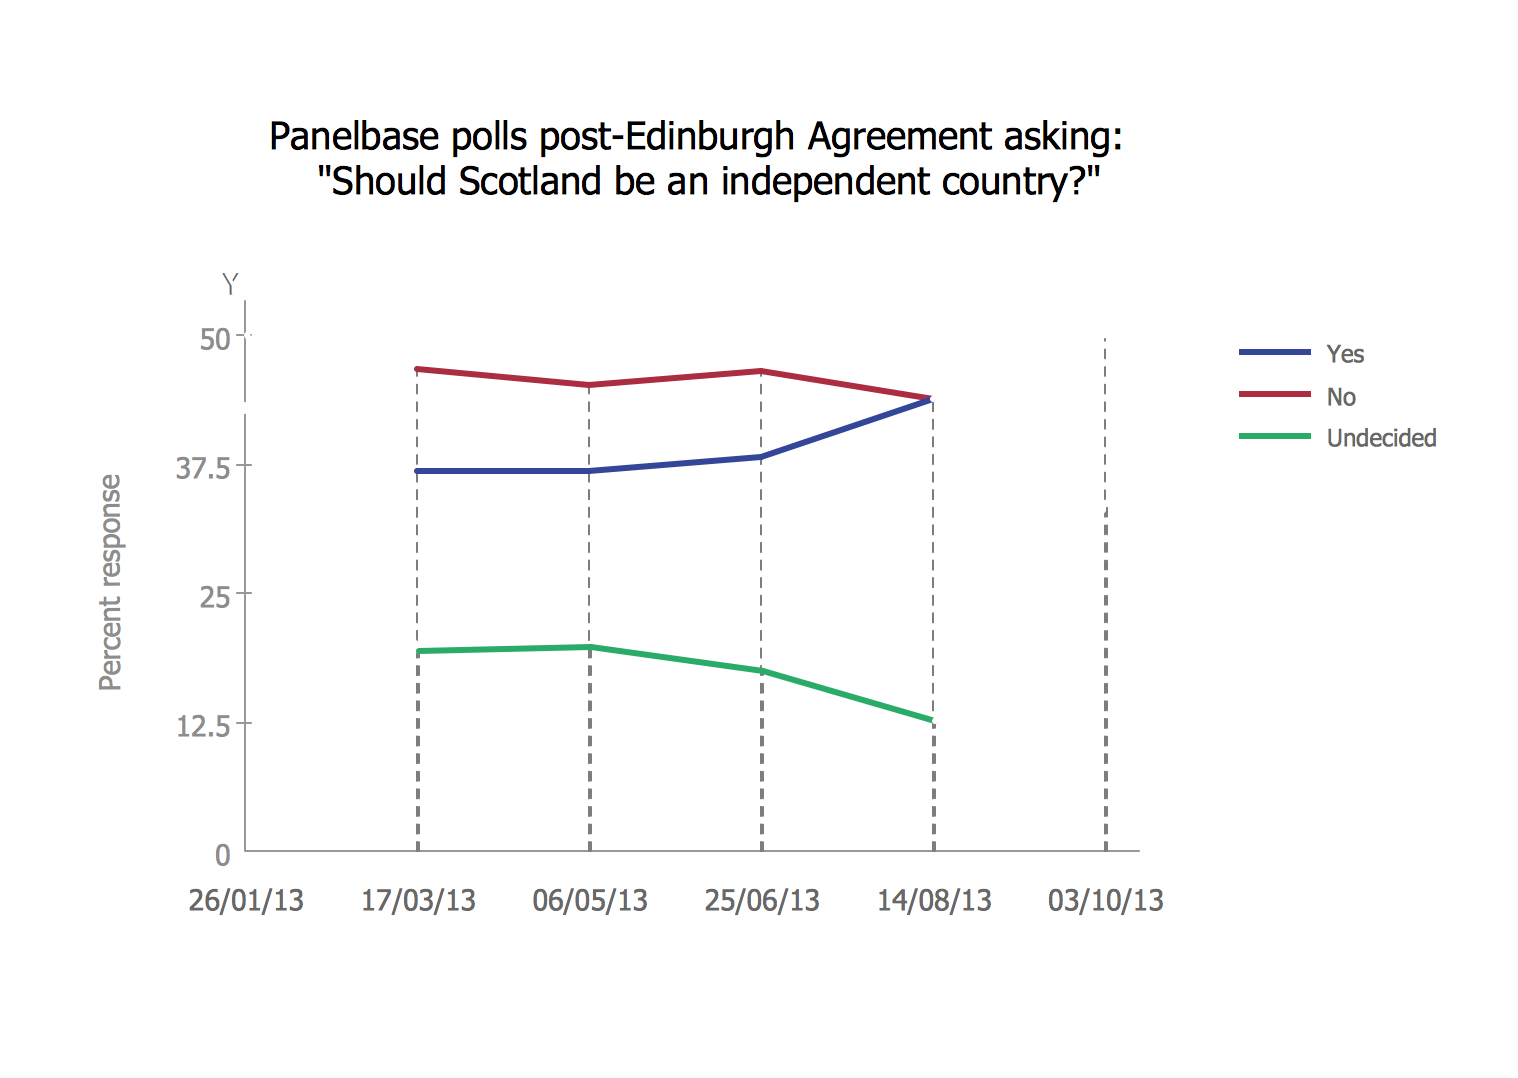
This sample shows the Scatter Chart that displays the polls on the referendum 2014 in Scotland. On this Scatter Chart the data are represented as points with two values of variables in the Cartesian coordinates. The points are connected by lines. This diagram can be useful in different opinion polls, referendums, for creating the reports.Matrix Organization Structure
Matrix organizational structure is one of the main forms of structures which is actively used by organizations to carry forth the functions of a company visually and effectively. Now we have ConceptDraw PRO diagramming and vector drawing software extended with 25 Typical Orgcharts solution from the Management area of ConceptDraw Solution Park which will help easy represent matrix organizational structure of any degree of complexity.Business Calendar
Business calendar is a special type of calendar, it must be functional, convenient for scheduling the affairs and meetings, and also must have strict, official and unobtrusive interface. So you must pay special attention to the business calendar design. Now you don't need to be an artist to design business calendar thanks to the unique drawing tools of Calendars Solution for ConceptDraw PRO diagramming and vector drawing software.- Png Circle Chart Blank
- Circle Spoke Diagram Template | Best Diagramming | Pie Chart ...
- Blank Circular Chart
- Iphone Blank Screen Png Wireframe
- 2 Variable Donut Chart Png
- Blank Logo Png
- Pie Charts | Percentages of the U.S. population by race | USA Maps ...
- Scatter Chart Examples | Scatter graph - Template | Scatter graphs ...
- Scatter Diagrams | Scatter Chart Examples | Scatter Graph Charting ...
- Percentages of the U.S. population by race | Pie Charts ...
- Blank Bar Graph
- Scatter Diagrams | Scatter Chart Examples | Scatter Graph | Scatter ...
- Percentage Pie Chart . Pie Chart Examples | Atmosphere air ...
- Top 5 Android Flow Chart Apps | School and Training Plans ...
- Percentage Pie Chart . Pie Chart Examples | Chart Templates | Chart ...
- Scatter Graph Charting Software | Scatter Plot | Scatter graphs ...
- Blank Circle Chart
- Blank Calendar | Bubble Chart | Lean Manufacturing Diagrams | Plot ...
- Sample Of Blank Circle Diagram
- Scatter Chart Examples | Blank Scatter Plot | Scatter Plot | Scatter ...


