Blank Scatter Plot
This sample shows the Scatter Plot without missing categories. It’s very important to no miss the data, because this can have the grave negative consequences. The data on the Scatter Chart are represented as points with two values of variables in the Cartesian coordinates. This sample can be used in the engineering, business, statistics, analytics, at the creating the financial and other types of reports.HelpDesk
How to Draw a Pictorial Chart in ConceptDraw PRO
Pictorial Infographics is used to visually present data comparison. Pictorial charts use relative sizes or repetitions of the same icon, picture, or symbol to show data relation. Using a Pictorial chart to show business data patterns and trends will add much more efficiency to your business communications. Finding the right tool for the job can sometimes be tricky. Developing sophisticated and effective infographics can require toolsthat may span many different products. Fortunately, ConceptDraw PRO has everything you need to create polished Pictorial Infographics that beautifully and accurately represent your story, no matter how complex it may be.HelpDesk
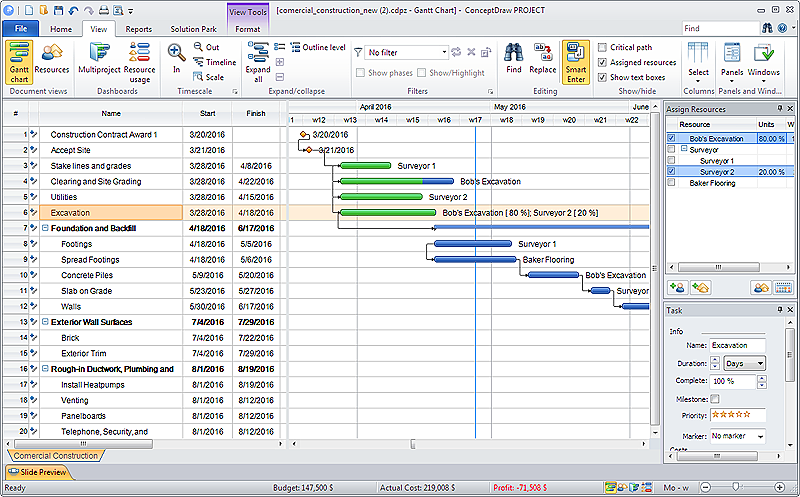
How to Plan and Allocate Resources in Your Project with ConceptDraw PROJECT for Windows
Effective resource management is a key factor in the successful project implementation. The common types of resources for which the project manager has an impact, include material resources (materials, energy), staff (work) and equipment. CoceptDraw PROJECT provides easy ways to project Resources Management: Create a list of project resources and assign the right human resource, as well as the necessary material, or equipment to be used.HelpDesk
How to Use ConceptDraw Sales Dashboard Solution
The interactive visual dashboard is a valuable tool for any sales team. Sales dashboard allows you to view and monitor sales indicators that are important for manager and sales staff . It helps to use the timely and reliable information to improve the quality of sales performance and increase sales revenues. ConceptDraw Sales Dashboard solution is a tool for both: sales manager and sales team. It provides the visualization of key performance indicators that are critical to the entire sales organization. The custom sales dashboard displays the real-time information on sales performance KPIs with the help of intuitive and easy-to-understand diagrams and charts. Sales Dashboard helps the entire team see where they are, and what needs to be done. With ConceptDraw PRO you can easily create a visual Sales Dashboard using Live Objects Technology.
HelpDesk
How to Create a Time Series Dashboard
Time Series Dashboard means an integration of some type of diagrams: Line Charts, Bar Charts, Column Charts, and Dot Plots on a single space. The ConceptDraw Time Series Dashboard solution can be used to create the interactive Time Series dashboard. The libraries of Time Series Charts solution contain the Live Objects, that can change their appearance depending on the external data. Each chart from the Time Series dashboard displays particular source data. You can include Time Series Charts in your business or technical dashboards to show and compare the items changing over time.Pie Chart Examples and Templates
A pie chart or a circle graph is a circular chart divided into sectors, illustrating numerical proportion. In a pie chart, the arc length of each sector and consequently its central angle and area, is proportional to the quantity it represents. Pie chart examples and templates created using ConceptDraw PRO software helps you get closer with pie charts and find pie chart examples suite your needs.Donut Chart Templates
These donut chart templates was designed using ConceptDraw PRO diagramming and vector drawing software extended with Pie Charts solution from Graphs and Charts area of ConceptDraw Solution Park. All these donut chart templates are included in the Pie Charts solution. You can quickly rework these examples into your own charts by simply changing displayed data, title and legend texts.HelpDesk
How to Create a Sales Dashboard
Visual dashboard is a valuable tool for any sales team. Sales dashboard allows you to view and monitor sales indicators that are important for manager and sales staff . It helps to use the timely and reliable information to improve the quality of sales performance and increase sales revenues. ConceptDraw Sales Dashboard solution is a tool for both: sales manager and sales team. It provides the visualization of key performance indicators that are critical to the entire sales organization. The custom sales dashboard displays the real-time information on sales performance KPIs with the help of intuitive and easy-to-understand diagrams and charts.
 Pie Charts
Pie Charts are extensively used in statistics and business for explaining data and work results, in mass media for comparison (i.e. to visualize the percentage for the parts of one total), and in many other fields. The Pie Charts solution for ConceptDraw PRO v10 offers powerful drawing tools, varied templates, samples, and a library of vector stencils for simple construction and design of Pie Charts, Donut Chart, and Pie Graph Worksheets.
Polar Graph
This sample shows the Polar Graph. The Polar Graph is a graph in the polar coordinate system in which the each point on the plane is defined by two values - the polar angle and the polar radius. The certain equations have very complex graphs in the Cartesian coordinates, but the application of the polar coordinate system allows usually produce the simple Polar Graphs for these equations.How Do You Make a Histogram?
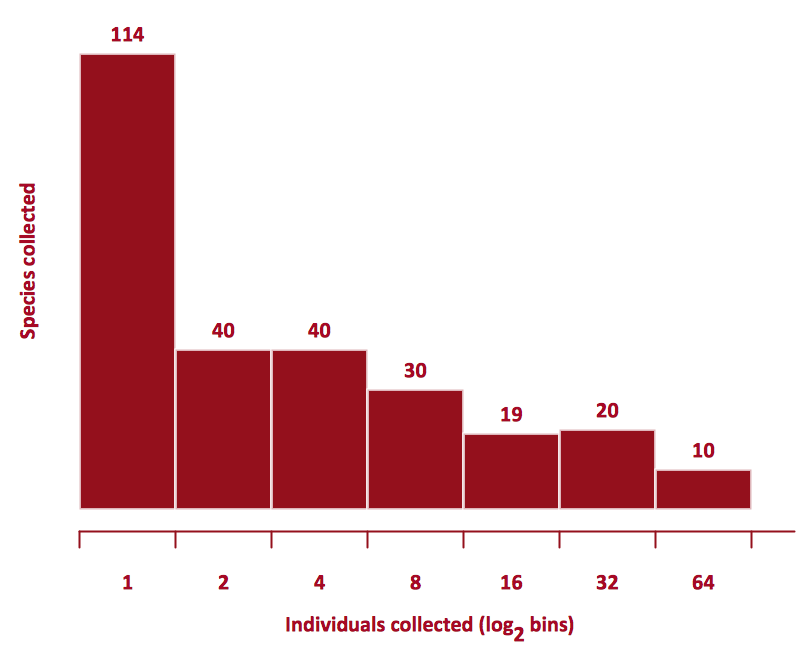
How do you make a histogram usually? Drawing of histogram is quite complex and lengthy process. Usually you have a set of data and you draw free-hand your diagram according to these data. But now thanks to the ConceptDraw PRO diagramming and vector drawing software extended with Histograms solution from the Graphs and Charts Area of ConceptDraw Solution Park this process became simple and fast.HelpDesk
How to Create a Building Plan Using ConceptDraw PRO
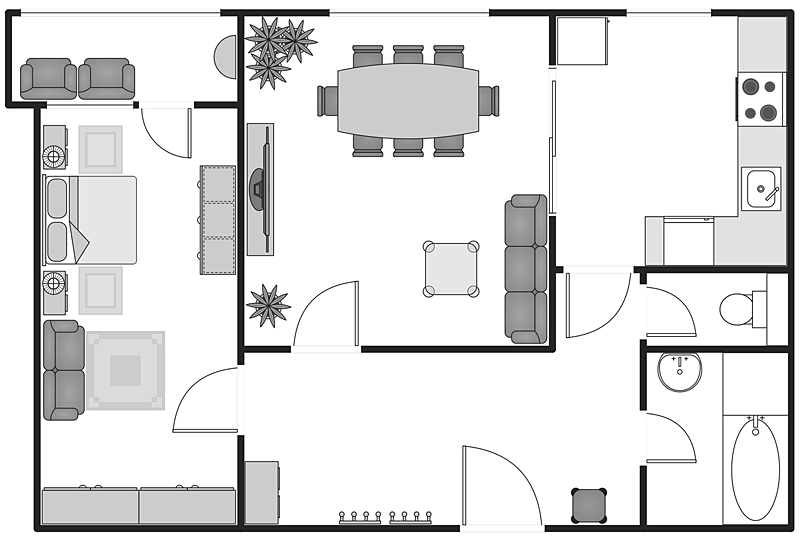
Making a home or apartment floor plans involves many different elements that can be managed using ConceptDraw PRO. The ability to design different floor plans is delivered by the Floor Plans solution. Using this solution you can easily create and communicate floor plans of any complexity.HelpDesk
How to Create a Floor Plan
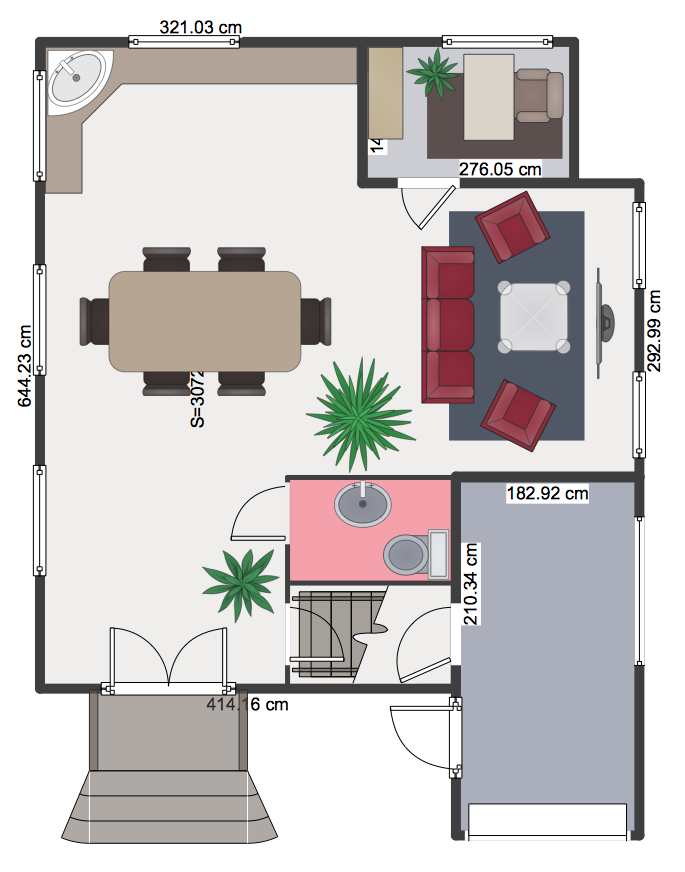
Making a floor plan is the best way to get a handle on how to organize your living space, and find out what could be changed. Creating a floor plan to scale is a challenge of the home and interior design process and can be noticeably helpful for visualizing things like furniture layout. You can use ConceptDraw?PRO to?produce layouts of?real estate properties. ConceptDraw PRO contains the large quantity of pre-designed vector objects that you can use for quick and easy designing such floor plans. You ?can easily determine the?size of?the?rooms and distances in?you drawing. The?ability to?create a floor plan is?delivered by?the?Floor Plans?solution. This solution extends ConceptDraw PRO with libraries that contains over 500 objects of floor plan elements. There is?a set of?special objects that?displays the?sizes, corners, squares and other technical details using?the?current measurements?of?units.How To Create Restaurant Floor Plan in Minutes
Developing Floor Plans, Design Drawings, Plans of Furniture Placement for restaurants and cafes is one of the most responsible and important steps at their construction and designing. Selection of favorable design, the right style of furniture and decors largely determine the success and atmosphere of the institution. The restaurant floor planner ConceptDraw PRO is a perfect choice for architects and designers. Enhanced with Cafe and Restaurant Floor Plans solution it offers a lot of extensive vector symbol libraries and building plan elements for drawing Restaurant floor plans, Restaurant layouts, Restaurant furniture layouts, Cafe floor plans, Bar area floor plan, Fast food restaurant plan, etc. With ConceptDraw PRO you don't need to be an artist to create great-looking restaurant floor plan drawings in minutes, all needed drawing tools are delivered by Building Plans area solutions. Construct your own general plan of restaurant's premises, choose the furniture for your taste from the Cafe and Restaurant Floor Plans solution libraries and arrange it on the plan as you desire fast and easy. ConceptDraw PRO has many of the features found in Visio for Mac such as Drawing, Connection, Shape and Editing Tools.
- Scatter Chart Examples | Blank Scatter Plot | Line Chart Examples ...
- Blank Scatter Plot | Scatter Chart Examples | Design elements ...
- Scatter Chart Examples | Blank Scatter Plot | Scatter Chart Analysis ...
- Design elements - Correlation charts | Blank Scatter Plot ...
- Blank Scatter Plot | Donut Chart Templates | Pie Chart Examples ...
- Bar Graphs | Blank Scatter Plot | Basic Diagramming | Sample Bar ...
- Scatter Diagram | Scatter Chart Examples | Design elements ...
- Pie Chart Word Template . Pie Chart Examples | Line Chart Template
- Chart Templates | Donut Chart Templates | Line Chart Templates ...
- Donut chart template
- Chart Examples | Design elements - Pie charts | Donut chart ...
- Line Chart Templates
- Pie Chart Software | Pie Chart Examples and Templates | Donut ...
- Arrow circle chart template | Circular arrows diagram - PDCA cycle ...
- Arrow circle chart template | Arrow pie chart template | Design ...
- Line chart - Percent of students achieved a 36 on ACT | Line graph ...
- Doughnut chart template | Pie Chart Software | Arrow pie chart ...
- Basic Diagramming | Percentage Spider Chart | Flow chart Example ...
- Pie Chart Software
- Arrow pie chart template | Pie chart - Domestic energy consumption ...


