Blank Scatter Plot
This sample shows the Scatter Plot without missing categories. It’s very important to no miss the data, because this can have the grave negative consequences. The data on the Scatter Chart are represented as points with two values of variables in the Cartesian coordinates. This sample can be used in the engineering, business, statistics, analytics, at the creating the financial and other types of reports.Scatter Chart Analysis. Scatter Chart Example
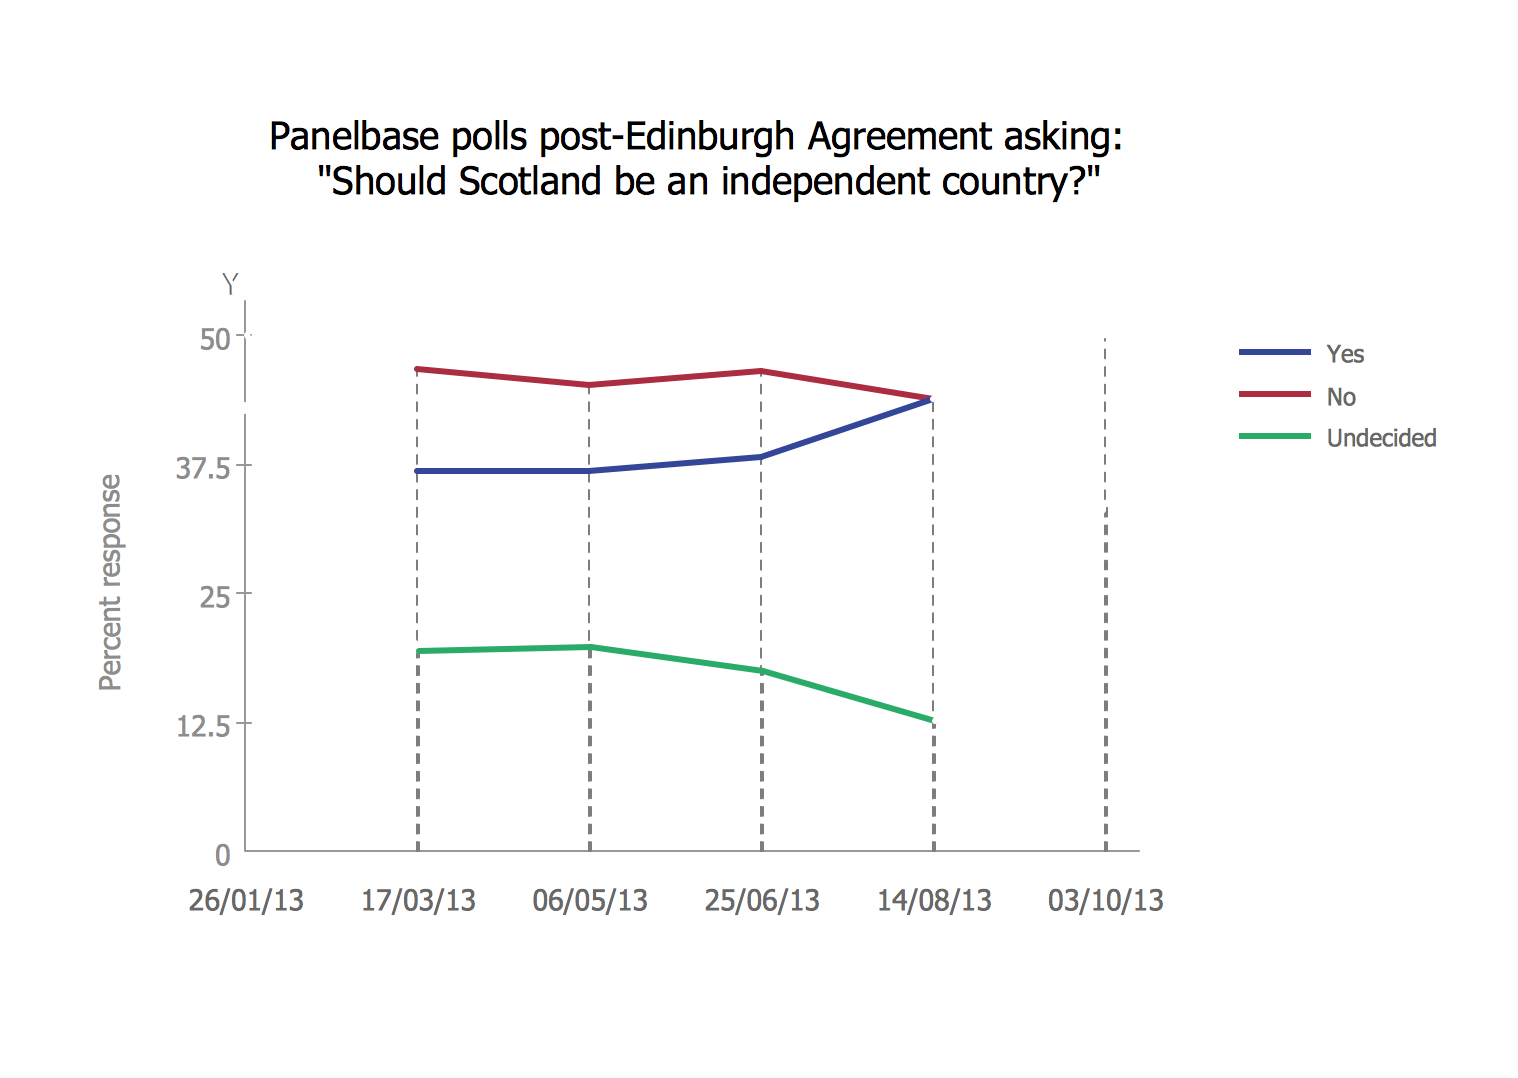
This sample shows the Scatter Chart that displays the polls on the referendum 2014 in Scotland. On this Scatter Chart the data are represented as points with two values of variables in the Cartesian coordinates. The points are connected by lines. This diagram can be useful in different opinion polls, referendums, for creating the reports.Scatter Chart Examples
The Line Graphs solution from Graphs and Charts area of ConceptDraw Solution Park contains a set of examples, templates and design elements library of scatter charts. Use it to draw scatter graphs using ConceptDraw DIAGRAM diagramming and vector drawing software for illustrating your documents, presentations and websites.Scatter Graph
You've got to draw the Scatter Graph and look for the convenient tool which will help you? Direct your attention on the ConceptDraw DIAGRAM diagramming and vector drawing software extended with Scatter Diagrams Solution from the Graphs and Charts Area.Scatter Graph Charting Software
ConceptDraw provides some interactive xy chart and scatter graph symbols that offers advanced features yet is simple to use.Scatter Diagram
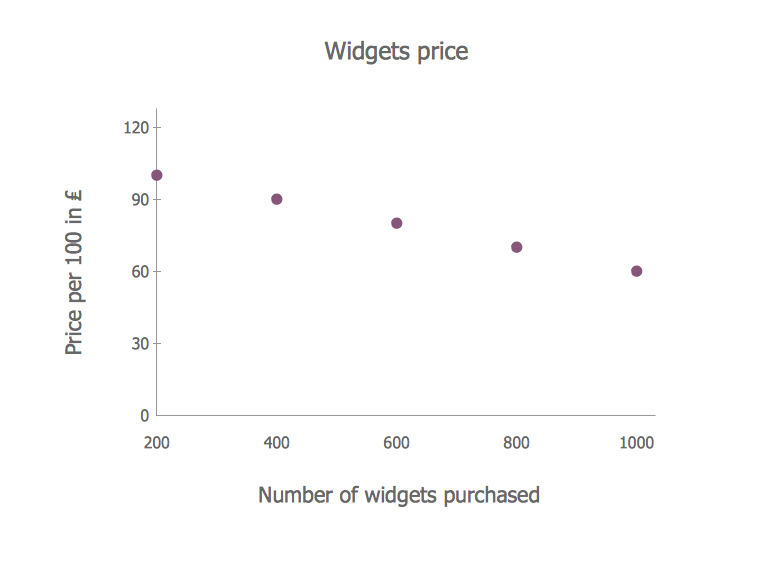
This sample shows the scatter diagram that displays the inverse correlation. The correlation measures the strength of association among two variables. You can see that when the number of widgets increases, the price per 100 widgets decreases. Using the ready-to-use objects from the Line Graphs Solution for ConceptDraw DIAGRAM you can create your own professional looking Scatter Charts quick and easy.Blank Calendar Template
The calendars around us everywhere in the modern world. There are a lot of calendar types, each of them has its own assignment: Business calendar, Personal calendar, Economic calendar, Financial calendar, Daily calendar, Monthly calendar, and many other useful calendar types. ConceptDraw DIAGRAM offers you the possibility to make your own unique calendars on the base of the Blank Calendar Template which is included to the Calendars Solution from the Management Area.Line Chart Template for Word
This sample was created in ConceptDraw DIAGRAM diagramming and vector drawing software using the Line Graphs Solution from Graphs and Charts area of ConceptDraw Solution Park. This sample shows the Line Chart of annual percentage change. The Line Chart allows you to clearly see the changes of data over the time.Bubble Plot
This sample was created in ConceptDraw DIAGRAM diagramming and vector drawing software using the Bubble Diagrams Solution from the ConceptDraw Solution Park. This sample shows the BCG (Boston Consulting Group) matrix that is used in marketing and product management for strategic analysis and planning.Percentage Spider Chart
ConceptDraw PRO creates drawings, diagrams and charts with great visual appeal in Mac OS X. This sample shows the Spider Chart that represents the buyer perceptions of the leather footwear industries in Brazil, India and Italy.- Draw Diagram on Mac | Example Of Scatter Plot On Mac
- Blank Line Chart
- Scatter Plot | How to Draw a Scatter Diagram Using ConceptDraw ...
- Scatter Chart Examples | Blank Scatter Plot | Scatter Plot | Scatter ...
- Scatter Diagrams | Blank Scatter Plot | How to Draw a Scatter ...
- Scatter Chart Examples | Scatter Diagrams | How to Draw a Scatter ...
- Blank Scatter Plot | Scatter Chart Examples | Scatter Plot | How To ...
- Scatter Plot | Design elements - Scatterplot | Blank Scatter Plot ...
- Scatter Graph Charting Software | Scatter Diagrams | How to Draw a ...
- Scatter Diagrams | How to Draw a Scatter Diagram Using ...


