Process Flowchart
The main reason of using Process Flowchart or PFD is to show relations between major parts of the system. Process Flowcharts are used in process engineering and chemical industry where there is a requirement of depicting relationships between major components only and not include minor parts. Process Flowcharts for single unit or multiple units differ in their structure and implementation. ConceptDraw PRO is Professional business process mapping software for making Process flowcharts, Process flow diagram, Workflow diagram, flowcharts and technical illustrations for business documents and also comprehensive visio for mac application. Easier define and document basic work and data flows, financial, production and quality management processes to increase efficiency of your business with ConcepDraw PRO. Business process mapping software with Flowchart Maker ConceptDraw PRO includes extensive drawing tools, rich examples and templates, process flowchart symbols and shape libraries, smart connectors that allow you create the flowcharts of complex processes, process flow diagrams, procedures and information exchange. Process Flowchart Solution is project management workflow tools which is part ConceptDraw Project marketing project management software. Drawing charts, diagrams, and network layouts has long been the monopoly of Microsoft Visio, making Mac users to struggle when needing such visio alternative like visio for mac, it requires only to view features, make a minor edit to, or print a diagram or chart. Thankfully to MS Visio alternative like ConceptDraw PRO software, this is cross-platform charting and business process management tool, now visio alternative for making sort of visio diagram is not a problem anymore however many people still name it business process visio tools.
 Business and Finance
Use Business and Finance solution to make professional-looking documents, presentations and websites, business, finance, advertising, and project management illustrations, or any designs that requires clipart of currency, office, business, advertising, management, marketing, people, time, post, contacts, collaboration, etc.
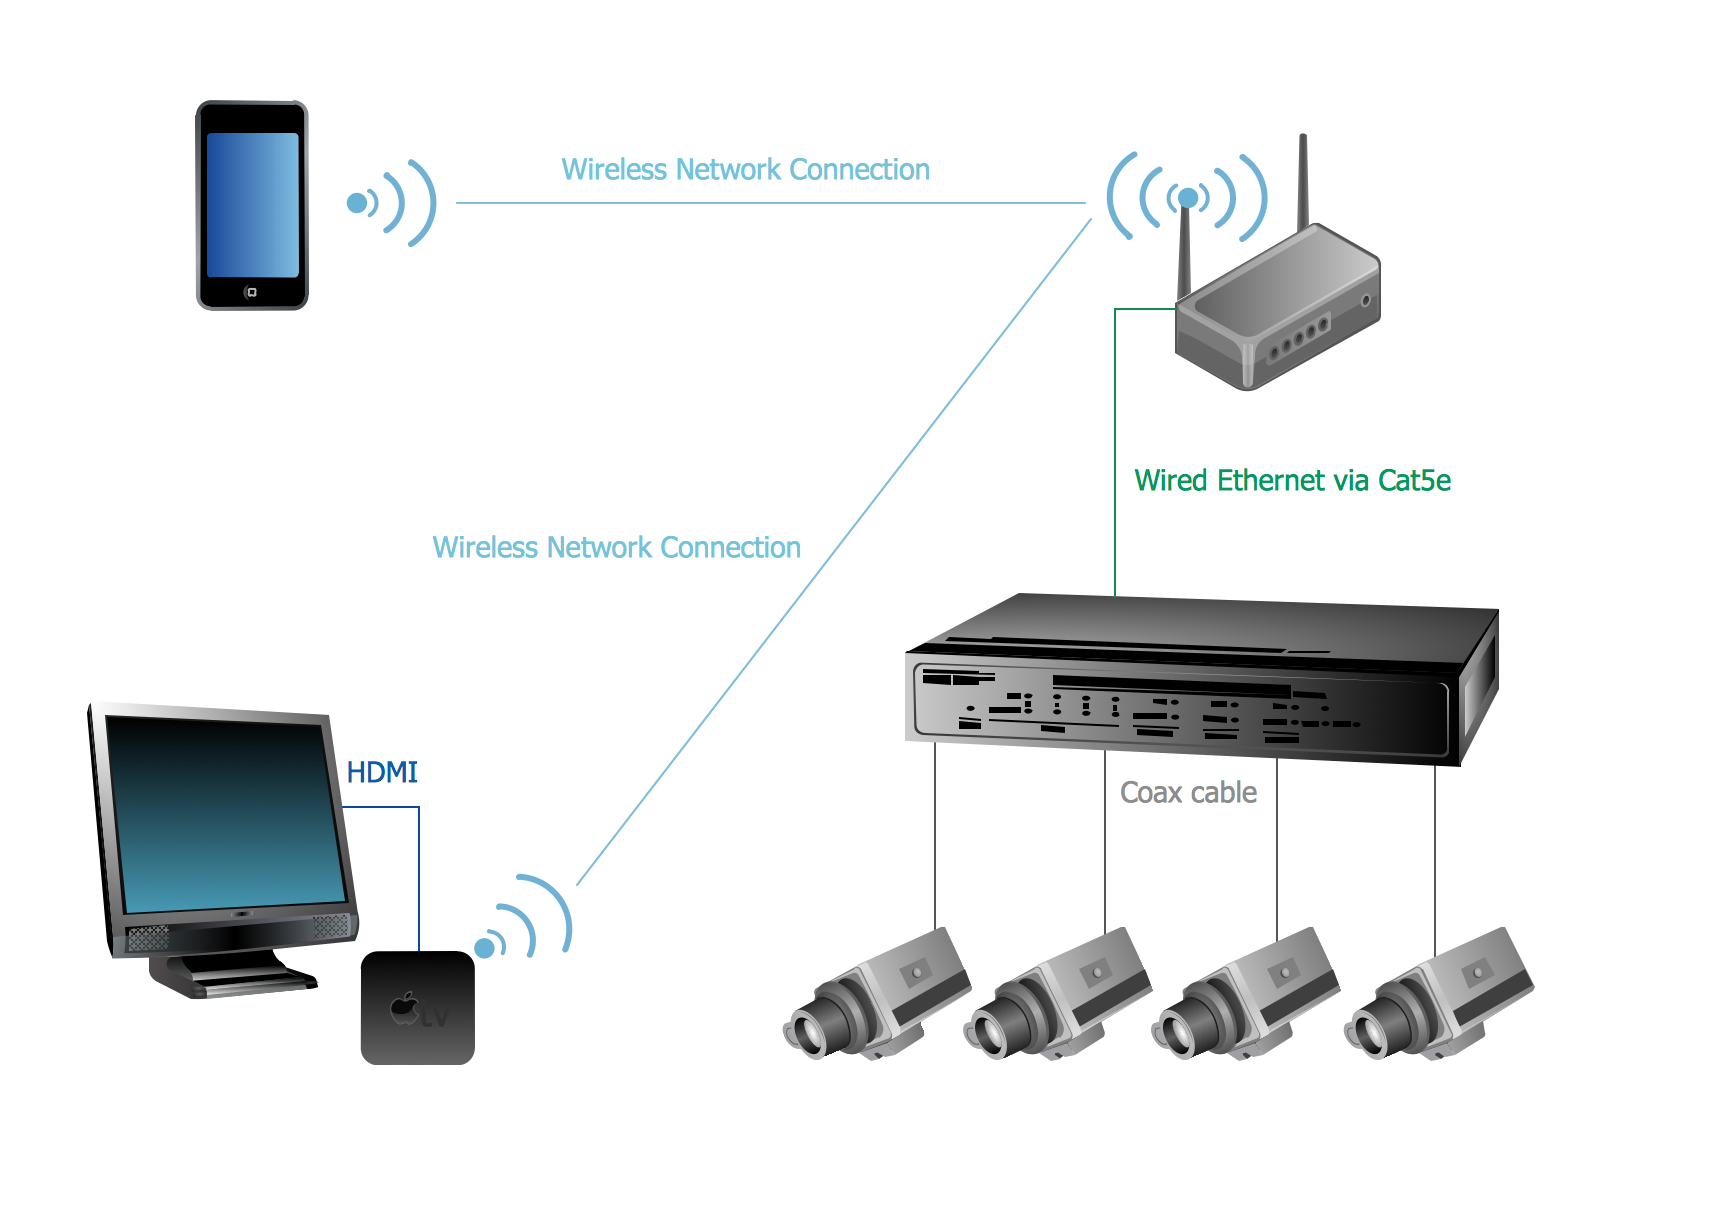
CCTV Network Example
The following examples cctv network were created in ConceptDraw PRO diagramming and vector drawing software using the Audio, Video, Media Solution. Using this easily customizable cctv network template you can represent any existing cctv network.Business and Finance Illustrations Example
ConceptDraw Business Finance Illustration examples and libraries contain vector clip art for drawing different Business and Finance Illustrations. You may find Advertising example, Project Management example, Business Model example and many more.Pyramid Diagram and Pyramid Chart
Pyramid Diagram, Triangle Chart or Triangular Diagram is a convenient and useful type of diagrams, which lets represent the data hierarchical structure and to illustrate the foundation-based relationships between the hierarchy levels. Pyramid Diagrams are used to visualize effectively the hierarchical, as well as proportional and foundation-based relationships, the process steps, the interconnections of organizational layers or topics. ConceptDraw PRO software enhanced with Pyramid Diagrams solution from Marketing area of ConceptDraw Solution Park is a powerful business charting software, that includes all required tools for designing the multilevel Pyramid Diagrams as quickly as possible. The build-in vector stencils and templates are the great aid for designers, a variety of examples and samples is a good base and source of inspiration. Use attractive and vivid 2D and 3D Pyramid Diagrams and Triangle Charts designed in ConceptDraw PRO to illustrate your documents, presentations, infographics, articles, reports, websites, etc.- Block Diagram Of Business Finance
- Block Diagram For Financial Management System
- Diagram Of Business Finance
- Block Diagrams | Block Diagram | Process Flowchart | Business ...
- Block Diagram Of Business
- Marketing Area | Target and Circular Diagrams | Micro Finance ...
- Business Models | Business model diagram | Business model ...
- Block diagram - Marketing targeting | Venn diagram - Internet ...
- Business model generation diagram | Business model diagram ...
- UML Diagram | Business and Finance | Audit Flowcharts | About ...
- Block diagram - Types of individual behavior in organization ...
- Workflow diagram - Weather forecast | Money - Vector stencils ...
- Audit Flowcharts | Financial Trade UML Use Case Diagram Example ...
- Process Flowchart | Block Diagrams | Business Process Diagram ...
- Block diagram - Six markets model | Functional Flow Block Diagram ...
- Process Flowchart | Financial Trade UML Use Case Diagram ...
- Block Diagram Of Formats Of Business
- Marketing and Sales Organization chart . Organization chart ...
- A Simple Business System Block Diagram
- Block diagram - Porter's five forces model | CORRECTIVE ACTIONS ...


