Business diagrams & Org Charts with ConceptDraw DIAGRAM
The business diagrams are in great demand, they describe the business processes, business tasks and activities which are executed to achieve specific organizational and business goals, increase productivity, reduce costs and errors. They let research and better understand the business processes. ConceptDraw DIAGRAM is a powerful professional cross-platform business graphics and business flowcharting tool which contains hundreds of built-in collections of task-specific vector stencils and templates. They will help you to visualize and structure information, create various Business flowcharts, maps and diagrams with minimal efforts, and add them to your documents and presentations to make them successful. Among them are Data flow diagrams, Organization charts, Business process workflow diagrams, Audit flowcharts, Cause and Effect diagrams, IDEF business process diagrams, Cross-functional flowcharts, PERT charts, Timeline diagrams, Calendars, Marketing diagrams, Pyramids, Target diagrams, Venn diagrams, Comparison charts, Analysis charts, Dashboards, and many more. Being a cross-platform application, ConceptDraw DIAGRAM is very secure, handy, free of bloatware and one of the best alternatives to Visio for Mac users.
HelpDesk
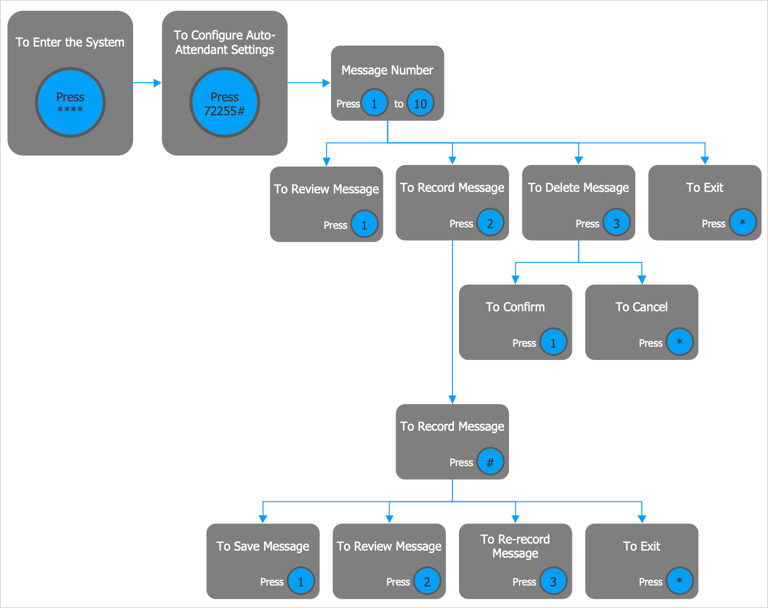
How to Create an Interactive Voice Response (IVR) Diagram
Interactive Voice Response (IVR) Diagram is used to create and conduct the Interactive Voice Response systems for call-centers and voice mail services. IVR diagrams intended to visualize the logical and physical structure of Interactive voice response systems. ConceptDraw solution for Interactive Voice Response (IVR) Diagram allows you to create and communicate the Interactive Voice Response diagram of any complexity. Interactive Voice Response (IVR) System is a telecommunication technology that enables a computer to automatically process voice and touch phone signals. IVR systems allows users to interact through a computer with various service systems, available by telephone. The objective of IVR system is to reduce customer service costs by delivering self service to customers and guiding them to the information that they look for.Basic Network Diagram
The Basic Network Diagram is an easy and effective way to design and document a simple network, it lets to represent visually and logically how the different network devices and computer equipment can be installed to meet the main business needs. ConceptDraw DIAGRAM software supplied with Computer Network Diagrams solution from the Computer and Networks area of ConceptDraw Solution Park is a perfect tool for drawing the Basic Computer Network diagrams, designs, schematics, and maps, network architectures, topologies, and layouts. Numerous vector libraries of network symbols, icons and components are incredibly helpful for IT and telecom engineers, stakeholders and end-users when designing Basic Network Diagrams, Common Network Diagrams, Common Network Topologies, 10Base-T Star Network Topologies, Bus Topology Diagrams, Communication Network Diagrams, System Designs, Regional Cable Head-End Diagrams, etc. Collection of predesigned samples and templates included to Computer Network Diagrams solution also greatly extends the capabilities of ConceptDraw DIAGRAM users.
Bubble diagrams in Landscape Design with ConceptDraw DIAGRAM
Bubble Diagrams are the charts with a bubble presentation of data with obligatory consideration of bubble's sizes. They are analogs of Mind Maps and find their application at many fields, and even in landscape design. At this case the bubbles are applied to illustrate the arrangement of different areas of future landscape design, such as lawns, flowerbeds, playgrounds, pools, recreation areas, etc. Bubble Diagram helps to see instantly the whole project, it is easy for design and quite informative, in most cases it reflects all needed information. Often Bubble Diagram is used as a draft for the future landscape project, on the first stage of its design, and in case of approval of chosen design concept is created advanced detailed landscape plan with specification of plants and used materials. Creation of Bubble Diagrams for landscape in ConceptDraw DIAGRAM software is an easy task thanks to the Bubble Diagrams solution from "Diagrams" area. You can use the ready scanned location plan as the base or create it easy using the special ConceptDraw libraries and templates.
 Circle-Spoke Diagrams
Examples of subject areas that are well suited to this approach are marketing, business, products promotion, process modeling, market, resource, time, and cost analysis. Circle-Spoke Diagrams are successfully used in presentations, conferences, management documents, magazines, reportages, reviews, reports, TV, and social media.
- How to Create an Interactive Voice Response (IVR) Diagram in ...
- Block Diagrams | Process Flowchart | Functional Flow Block ...
- Block Diagrams | Management Area | Draw Company Structure with ...
- Decision Making | Block diagram - Customer decision making ...
- Functional Organizational Structure | Process Flowchart | Block ...
- Block diagram - Types of individual behavior in organization | How ...
- Diagram Of Mannagement Reporting
- How to Draw a Gantt Chart Using ConceptDraw PRO | Business ...
- Software Work Flow Process in Project Management with Diagram ...
- Process Flowchart | Program Structure Diagram | Functional Block ...
- Block diagram - Types of individual behavior in organization | UML ...
- How to Draw an Organization Chart | Organizational Charts with ...
- How To Solve A Block Diagram In Flow Structure
- Block diagram - Types of individual behavior in organization ...
- Block diagram - Types of individual behavior in organization | Basic ...
- Block Diagram Of Data Structures
- 4 Level pyramid model diagram - Information systems types ...
- Sample Of A Block Diagram Of A Companies Organization
- Diagram Of Types Of Organizational Structure


