 Telecommunication Network Diagrams
Telecommunication Network Diagrams solution extends ConceptDraw DIAGRAM software with samples, templates, and great collection of vector stencils to help the specialists in a field of networks and telecommunications, as well as other users to create Computer systems networking and Telecommunication network diagrams for various fields, to organize the work of call centers, to design the GPRS networks and GPS navigational systems, mobile, satellite and hybrid communication networks, to construct the mobile TV networks and wireless broadband networks.
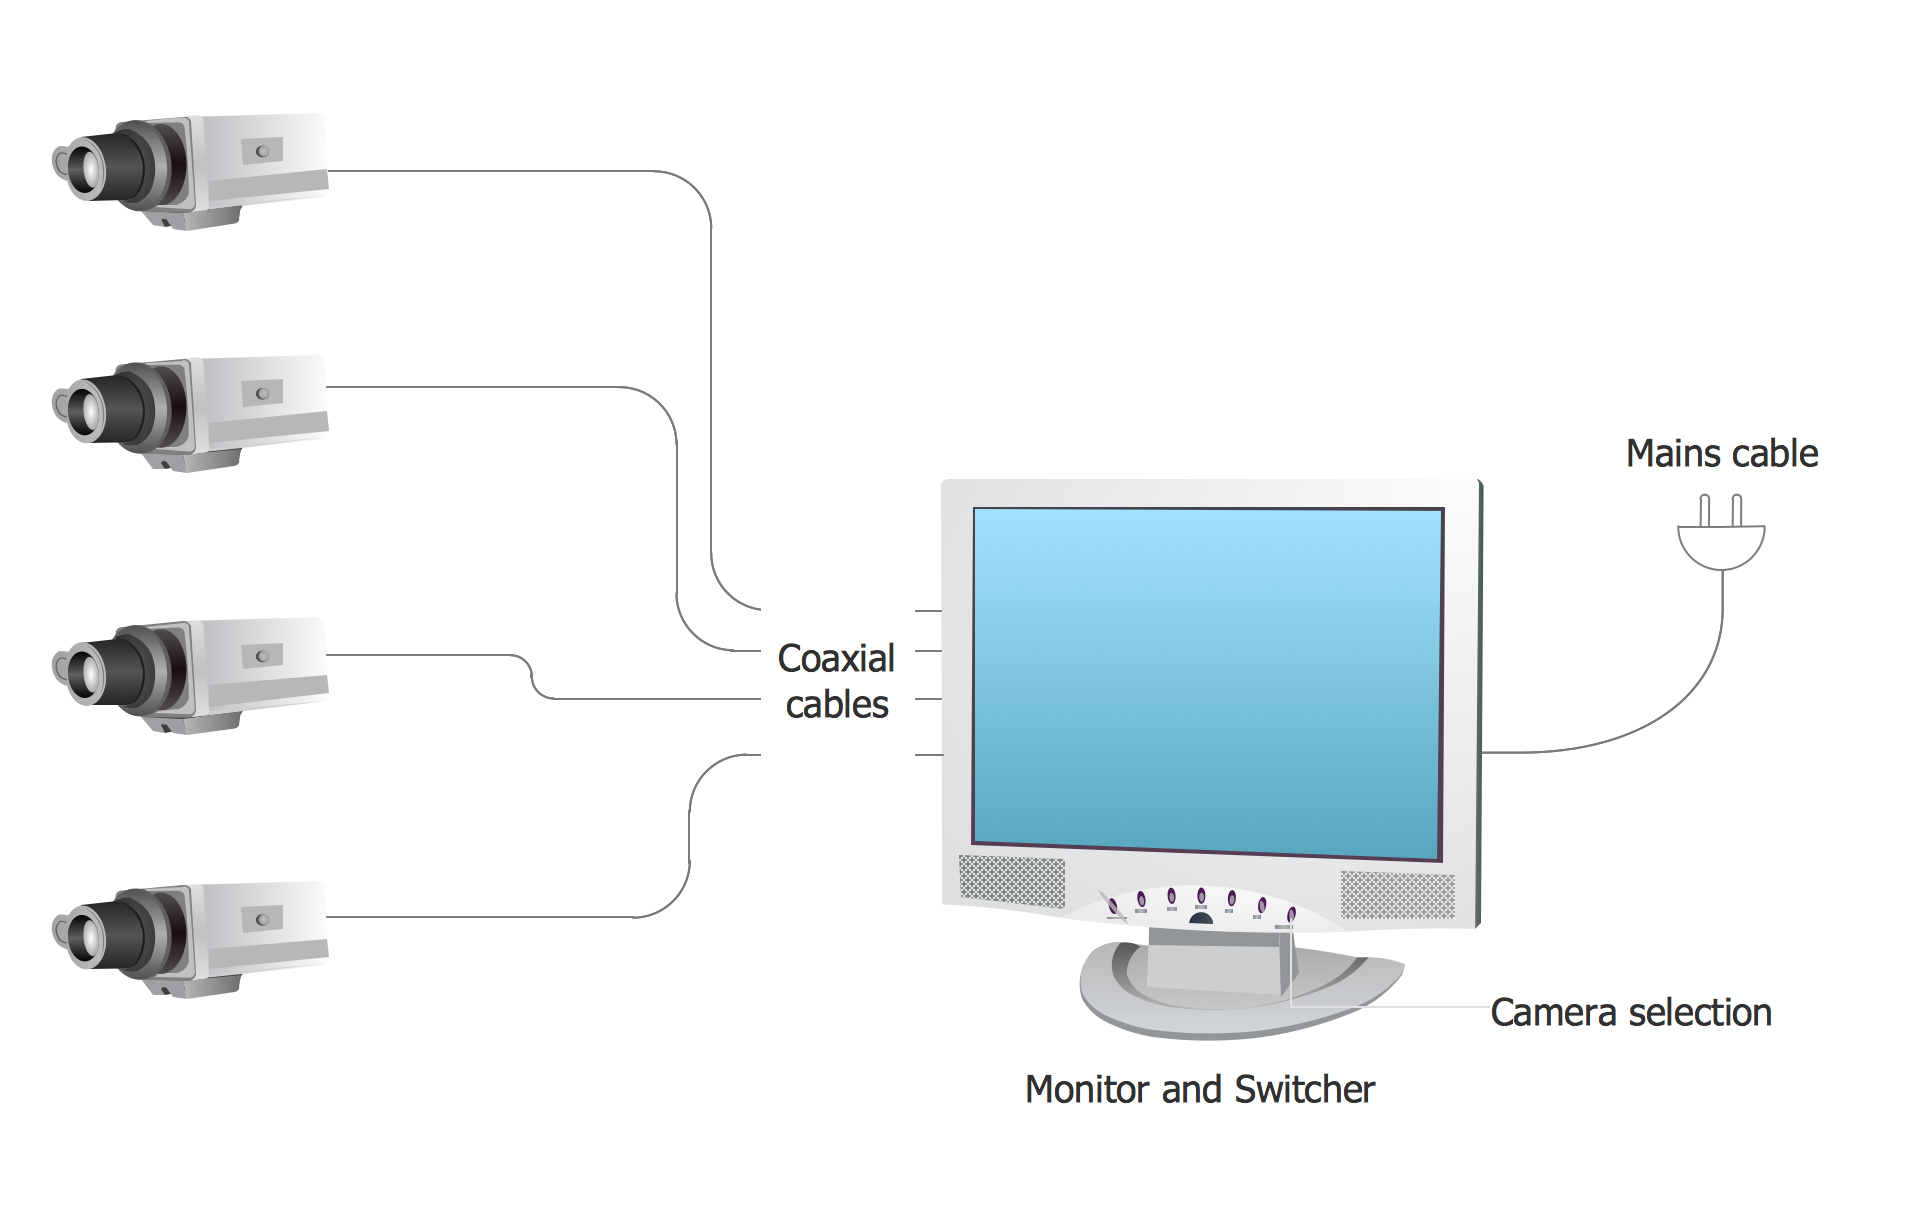
Basic CCTV System Diagram. CCTV Network Diagram Example
ConceptDraw DIAGRAM enhanced with Audio, Video, Media solution is a helpful tool for illustration of a CCTV network. It contains library of vector cliparts of video and TV devices and different digital gadgets for drawing such illustrations
 Computer and Networks Area
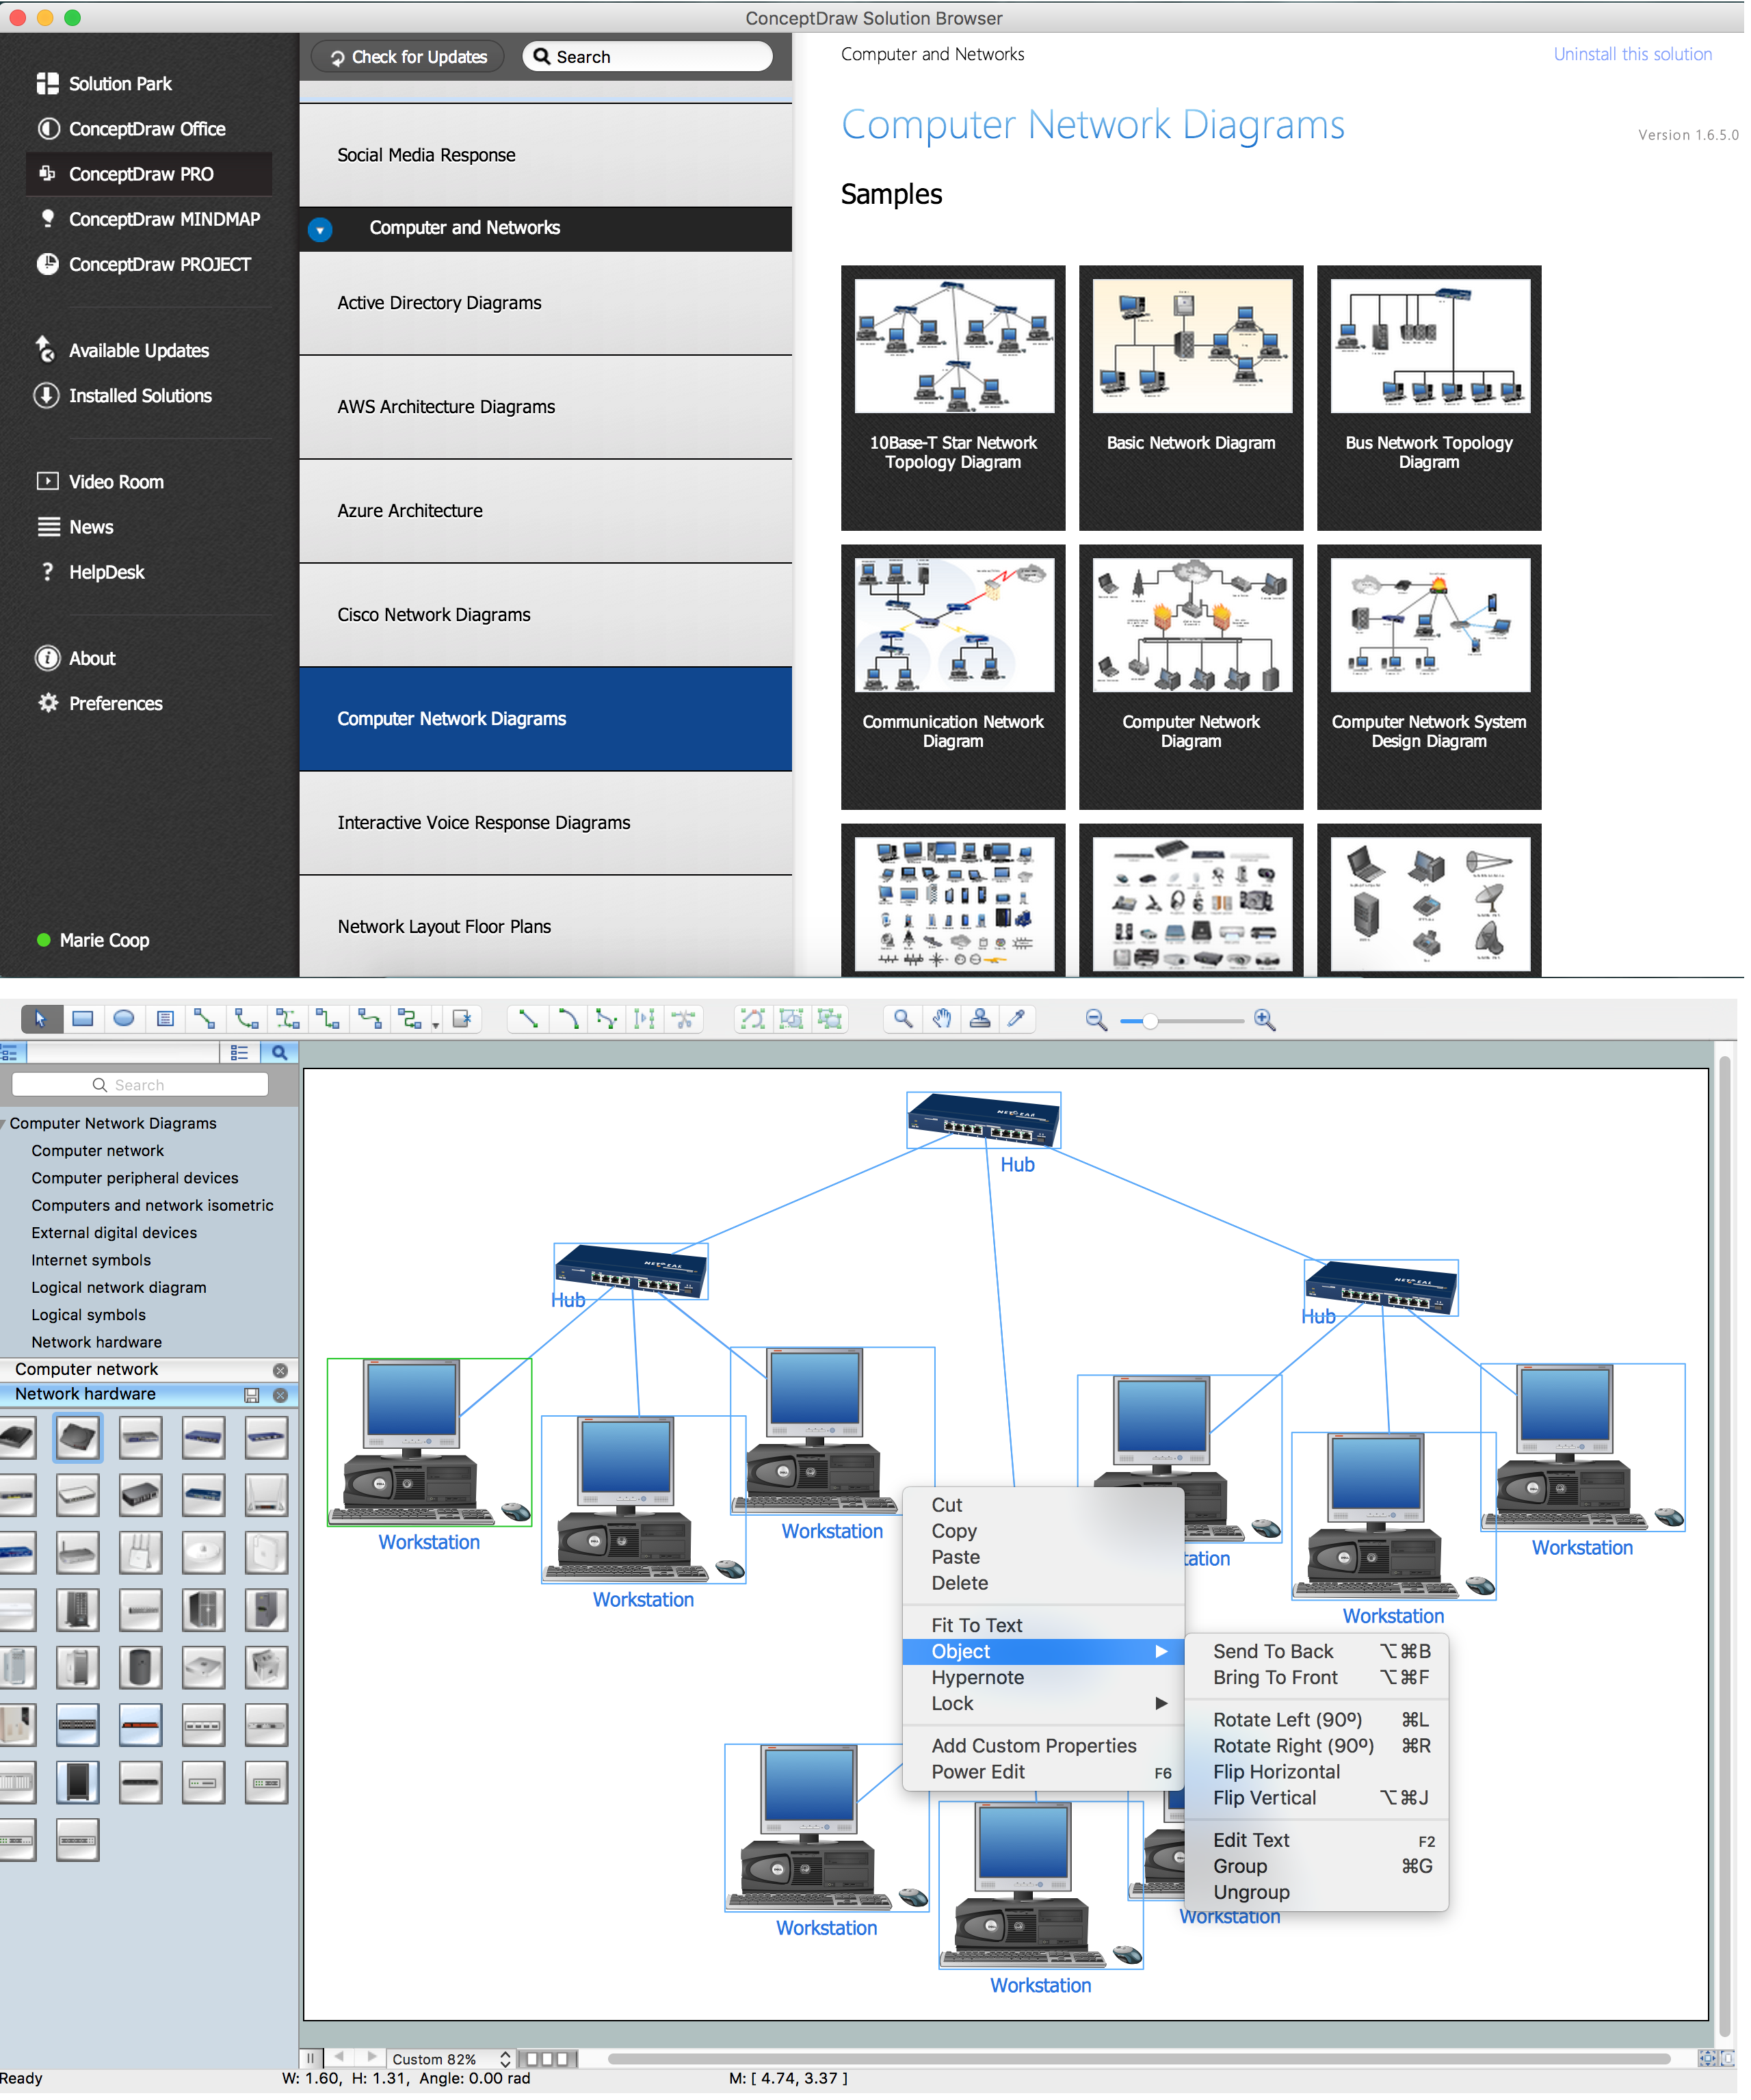
The solutions from Computer and Networks Area of ConceptDraw Solution Park collect samples, templates and vector stencils libraries for drawing computer and network diagrams, schemes and technical drawings.
 Target and Circular Diagrams
This solution extends ConceptDraw DIAGRAM software with samples, templates and library of design elements for drawing the Target and Circular Diagrams.
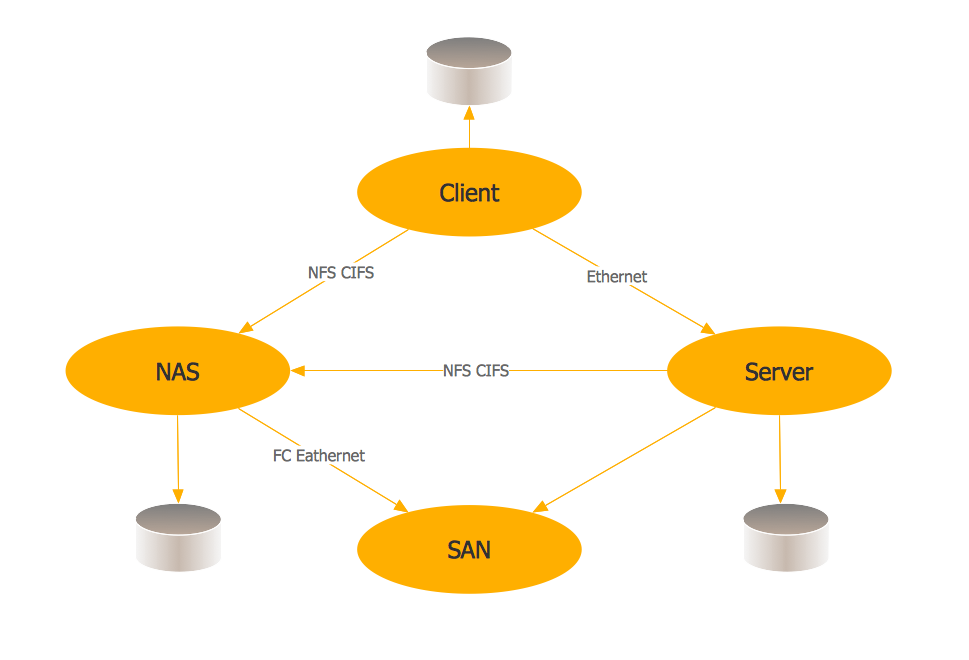
Storage area networks (SAN). Computer and Network Examples
A Storage area network (SAN) is a dedicated network that provides access to data storage and operations only on the block level. SAN usually has own network of storage devices/elements and disk arrays that are connected with each other and to a remote data-sharing network. SANs are widely used for enhancing the storage devices (optical jukeboxes, disk arrays, tape libraries) that are accessible for networked servers. This example was created in ConceptDraw DIAGRAM using the Computer and Networks Area of ConceptDraw Solution Park. It shows the hybrid of Storage area network (SAN) and Network Attached Storage (NAS) technologies.
Successful Strategic Plan
This sample shows the Strategic Plan of the Broadband Lifecycle that was developed by Strategic Networks Group. The Broadband Lifecycle represents the advance of the broadband investments.Internet Connectivity. Computer and Network Examples
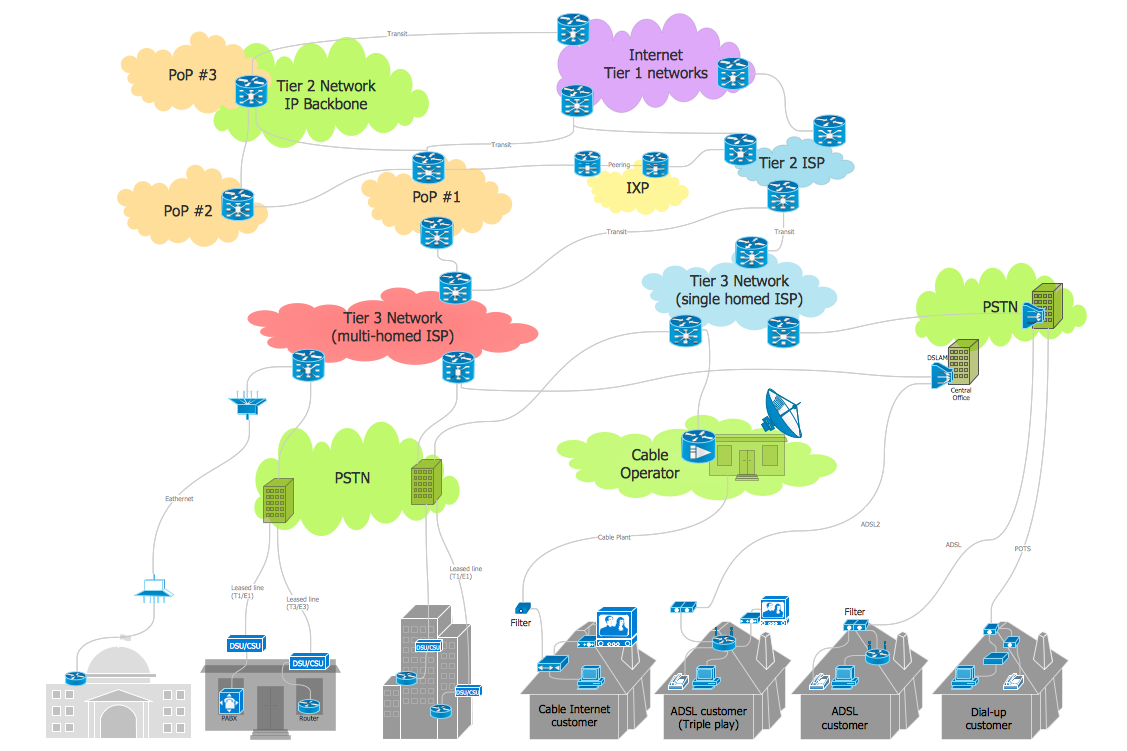
The Internet Connectivity of the computers, mobile devices, computer networks to the Internet enables the users to access the various Internet services. There are many ways and technologies of the connection to the Internet with different data signaling rates: Wireless, Ethernet cable, Optical fiber, Dial-up, DSL, broadband Internet access, etc. This example was created in ConceptDraw DIAGRAM using the Computer and Networks solution from the Computer and Networks area of ConceptDraw Solution Park and shows how the customers connect to ISPs and ISPs connect between the tiers (peering and transit).
Complete Network Topology
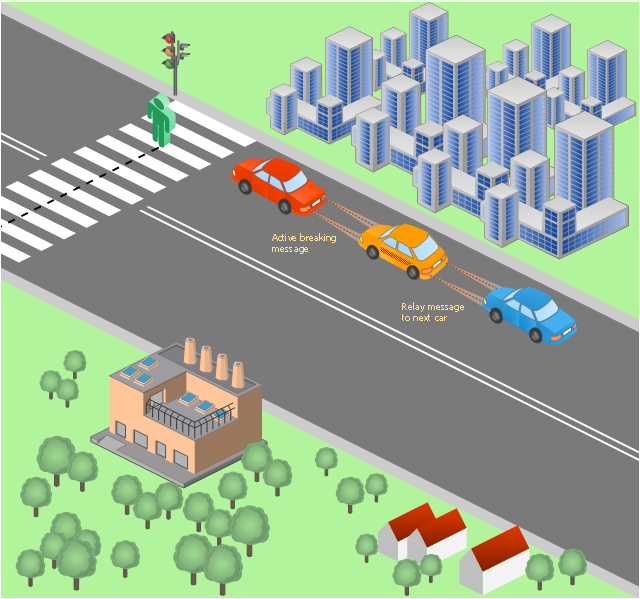
This sample was created in ConceptDraw DIAGRAM diagramming and vector drawing software using the Computer and Networks solution from Computer and Networks area of ConceptDraw Solution Park. A complete (fully connected) topology is a network topology in which there is a direct link between all pairs of nodes. In a fully connected network with n nodes, there are n(n-1)/2 direct links. Networks designed with this topology are usually very expensive to set up, but provide a high degree of reliability due to the multiple paths for data that are provided by the large number of redundant links between nodes.This vehicular network diagram sample was drawn on the base of picture illustrating the post "LED Traffic Signals and Vehicle Lights for Optical Broadband Communications" from the blog "Terranautix".
"Visible Light Communication (VLC) is a rapidly emerging field that focuses on the use of light sources (between 400 THz and 800 THz) for the primary purpose of broadband communications. In order to transmit data over light, the light source (transceiver) is pulsed on and off rapidly to create a data stream, similar to fiber optic communications, but in the wireless form, or “Free-Space Optical Transmission“. By pulsing lights many thousands (and millions) of times per second, data transmission occurs at a rate undetectable by the human eye. Optical receivers convert the light pulses to an electronic signal on the receiver end. The Light Emitting Diode (LED) is the primary form factor currently undergoing extensive research."
[terranautix.com/ tag/ communications]
The vehicular network diagram example "Visible light communication" was created using the ConceptDraw PRO diagramming and vector drawing software extended with the Vehicular Networking solution from the Computer and Networks area of ConceptDraw Solution Park.
Used Solutions
Internet solutions with ConceptDraw DIAGRAM
ConceptDraw is a good means of visualization of information of any kind as it features powerful graphic capabilities. The conception of using ConceptDraw and open formats by the programs that work with Internet can be used for displaying any data and any structure in Internet.Swot Analysis Examples for Mac OSX
SWOT is an acronym of the words Strengts, Weaknesses, Opportunities and Тhreats. SWOT analysis is used to show the real situation and prospects of the company on the market, the internal environment of the company is reflected by S and W, and external by O and T. SWOT analysis is a quality tool for structuring available information, which is successfully used in the process of strategy planning, it helps analysts in formulation recommendations on the basis of collected information and data, structured in a form of SWOT Matrix. The SWOT analysis is effective and simple in use, however its results in great depend on the completeness and quality of initial information, from the depth of understanding of the current state and development trends of the market, and also from the used software. ConceptDraw DIAGRAM extended with powerful tools of SWOT and TOWS Matrix Diagrams solution, containing templates and SWOT analysis examples for Mac OSX and Windows, is ideal software for creation professional SWOT Matrices and SWOT Analysis Matrices.- Draw Block Diagram Of Broadband Network
- Block Diagram Of Wired Lan
- Basic Block Diagram Of Broadband Wirless Network
- Basic Block Diagram Of Telecommunication Network
- Wireless broadband network diagram | Illustrate the Computer ...
- Telecommunication Network Diagrams | Basic CCTV System ...
- Wireless Networks | Building Plans Area | Wifi Basic Block Diagram
- Wireless Networks | Basic Network Diagram | Building Plans Area ...
- Broadband Block Diagram
- Basic Block Diagram For Network
- Broadband Network Block Diagram
- Block Diagram Of Basic System Of Wired And Wireless
- Basic Block Diagram Of Broadband Connection
- Block Diagram Of Broadband Network
- Sample Pc Based Network Example Block Diagram
- Visible light communication | Vehicular Networking | Block Diagram ...
- Block Diagram | Block Diagram Software | Basic Diagramming ...
- Diagram Of Broadband Communication Network
- Wireless broadband network diagram | Tree Network Topology ...
- Block Diagram Of Broadband Network Services
