The vector clipart library "Arrows" contains 37 arrows which you can easy use in your presentation slides and illustrations.
The clip art example "Arrows - Vector clipart library" was created in the ConceptDraw PRO diagramming and vector drawing software using the Presentation Clipart solution from the Illustration area of ConceptDraw Solution Park.
The clip art example "Arrows - Vector clipart library" was created in the ConceptDraw PRO diagramming and vector drawing software using the Presentation Clipart solution from the Illustration area of ConceptDraw Solution Park.
How to Build a Flowchart
The ConceptDraw PRO is a professional software for quick creating great looking flowcharts. The vector stencils from object libraries allows you to use RapidDraw technology. By the clicking on direction arrows one can add new object to flowcharts. This technology gives to users the ability to fast creating visualization for the structural data. Learn the basics of flowcharting and see how to build create a flowchart using ConceptDraw automatic drawing tools.The vector clipart library "Arrows" contains 37 arrows which you can easy use in your presentation slides and illustrations.
The clip art example "Arrows - Vector clipart library" was created in the ConceptDraw PRO diagramming and vector drawing software using the Presentation Clipart solution from the Illustration area of ConceptDraw Solution Park.
The clip art example "Arrows - Vector clipart library" was created in the ConceptDraw PRO diagramming and vector drawing software using the Presentation Clipart solution from the Illustration area of ConceptDraw Solution Park.
 Computer Network Diagrams
Computer Network Diagrams solution extends ConceptDraw PRO software with samples, templates and libraries of vector icons and objects of computer network devices and network components to help you create professional-looking Computer Network Diagrams, to plan simple home networks and complex computer network configurations for large buildings, to represent their schemes in a comprehensible graphical view, to document computer networks configurations, to depict the interactions between network's components, the used protocols and topologies, to represent physical and logical network structures, to compare visually different topologies and to depict their combinations, to represent in details the network structure with help of schemes, to study and analyze the network configurations, to communicate effectively to engineers, stakeholders and end-users, to track network working and troubleshoot, if necessary.
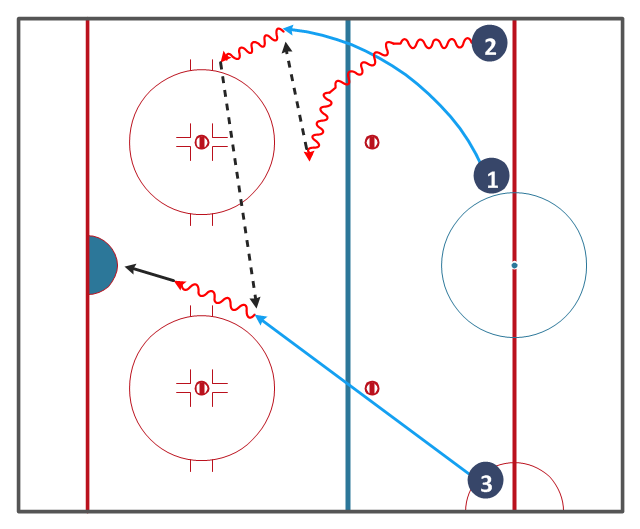
"The blue lines divide the rink into three zones. The central zone is called the neutral zone or simply centre ice. The generic term for the outer zones is end zones, but they are more commonly referred to by terms relative to each team. The end zone in which a team is trying to score is called the attacking zone or offensive zone; the end zone in which the team's own goal net is located is called the defending zone or defensive zone.
The blue line is considered part of whichever zone the puck is in. Therefore, if the puck is in the neutral zone, the blue line is part of the neutral zone. It must completely cross the blue line to be considered in the end zone. Once the puck is in the end zone, the blue line becomes part of that end zone. The puck must now completely cross the blue line in the other direction to be considered in the neutral zone again." [Ice hockey rink. Wikipedia]
The hockey drill diagram example "Entering offensive zone" was created using the ConceptDraw PRO diagramming and vector drawing software extended with the Hockey solution from the Sport area of ConceptDraw Solution Park.
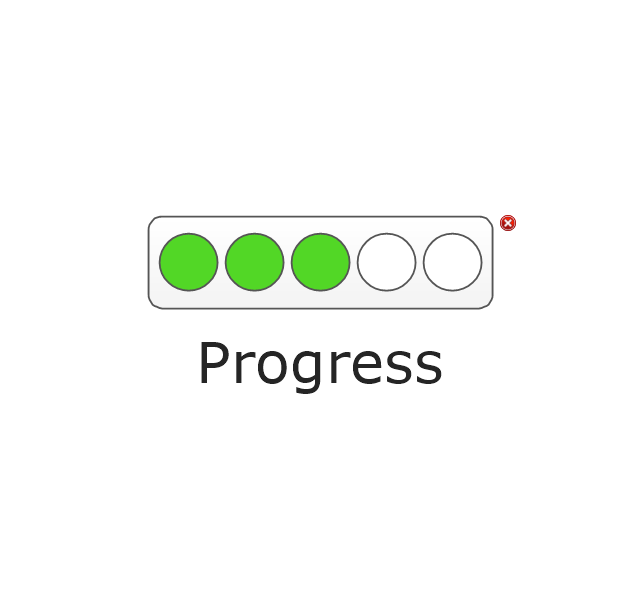
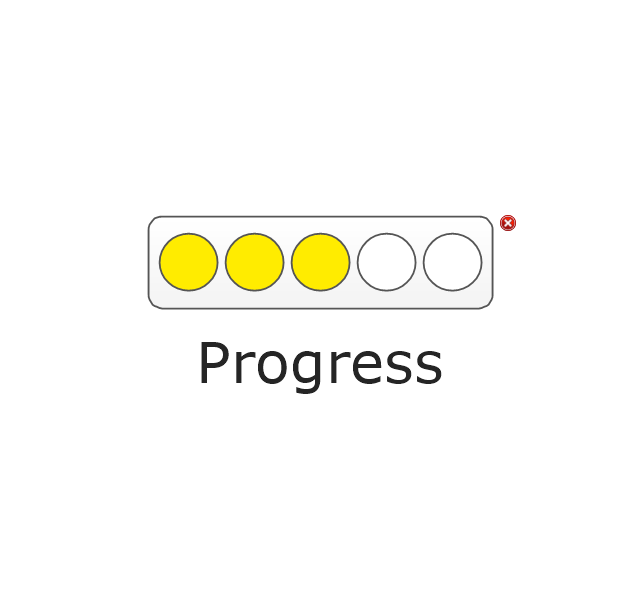
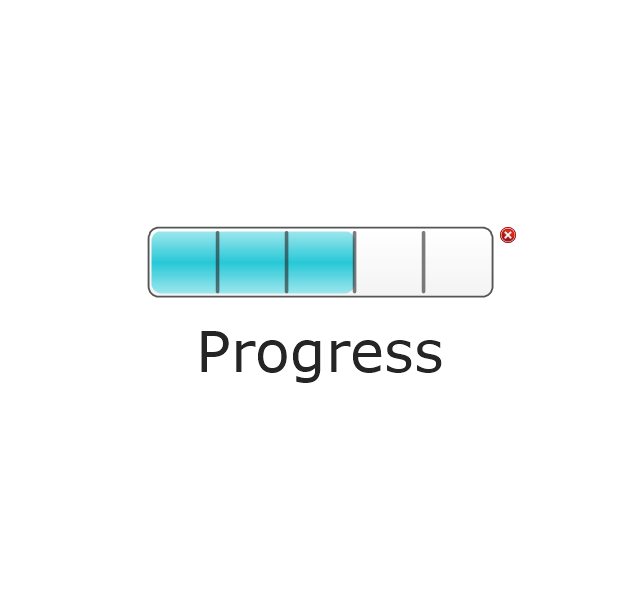
The vector stencils library "Status indicators" contains 41 visual status indicators. Each status indicator can visualize one of 2-6 information states and have a caption.
Use it to create your business performance dashboards in the ConceptDraw PRO diagramming and vector drawing software extended with the Status Dashboard solution from the area "What is a Dashboard" of ConceptDraw Solution Park.
Use it to create your business performance dashboards in the ConceptDraw PRO diagramming and vector drawing software extended with the Status Dashboard solution from the area "What is a Dashboard" of ConceptDraw Solution Park.
Circular Arrow
ConceptDraw PRO diagramming and vector drawing software extended with Circular Arrows Diagrams solution from the "Diagrams" Area is a powerful software that will help you design professional looking Circular Arrow Diagrams.ERD Symbols and Meanings
Entity Relationship Diagram (ERD) is a popular software engineering tool for database modeling and illustration the logical structure of databases, which uses one of two notations - Chen's or Crow’s Foot. Crow's foot notation is effective when used in software engineering, information engineering, structured systems analysis and design. Each of these notations applies its own set of ERD symbols. Crow's foot diagrams use boxes to represent entities and lines between these boxes to show relationships. Varied shapes at the ends of lines depict the cardinality of a given relationship. Chen's ERD notation is more detailed way to represent entities and relationships. ConceptDraw PRO application enhanced with all-inclusive Entity-Relationship Diagram (ERD) solution allows design professional ER diagrams with Chen's or Crow’s Foot notation on your choice. It contains the full set of ready-to-use standardized ERD symbols and meanings helpful for quickly drawing, collection of predesigned ERD samples, examples and templates. ConceptDraw Pro is a great alternative to Visio for Mac users as it offers more features and can easily handle the most demanding professional needs.
- Blue Arrow Icon
- Seven Basic Tools of Quality | Blue Wind Arrow Symbol Png
- Vectors Png Arrows Blue
- Arrows - Vector clipart library
- Arrows - Vector clipart library
- Arrow Blue Png
- Presentation Clipart | Arrows - Vector clipart library | Winter Sports ...
- Circular Arrows Blue
- Arrows - Vector clipart library | Presentation Clipart | Bubble ...
- Arrows - Vector clipart library





















-arrows---vector-clipart-library.png--diagram-flowchart-example.png)
-arrows---vector-clipart-library.png--diagram-flowchart-example.png)

