Export from ConceptDraw DIAGRAM Document to a Graphic File


Flowchart design. Flowchart symbols, shapes, stencils and icons


Pyramid Diagram

Business Productivity - Marketing

SWOT Matrix Template

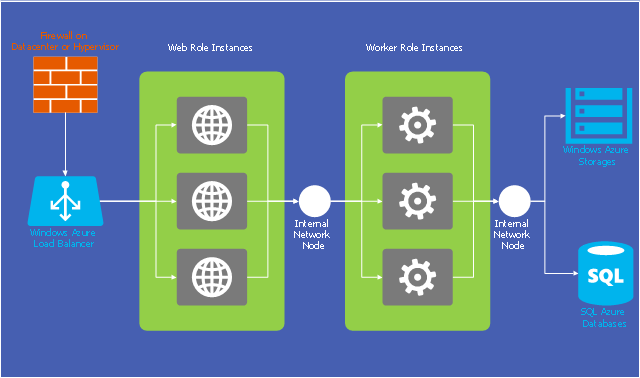
This example of cloud computing system architecture diagram was redesigned from the Wikimedia Commons file: Windows Azure Network and Computes Architecture.png. [commons.wikimedia.org/ wiki/ File:Windows_ Azure_ Network_ and_ Computes_ Architecture.png]
This file is licensed under the Creative Commons Attribution-Share Alike 2.0 license. [creativecommons.org/ licenses/ by-sa/ 2.0/ ]
"Microsoft Azure (formerly Windows Azure before 25 March 2014) is a cloud computing platform and infrastructure, created by Microsoft, for building, deploying and managing applications and services through a global network of Microsoft-managed datacenters. It provides both PaaS and IaaS services and supports many different programming languages, tools and frameworks, including both Microsoft-specific and third-party software and systems." [Microsoft Azure. Wikipedia]
The diagram example "Microsoft Azure network and computes architecture" was created using ConceptDraw PRO diagramming and vector drawing software extended with the Azure Architecture solution from the Computer and Networks area of ConceptDraw Solution Park.
Cloud computing system architecture diagram
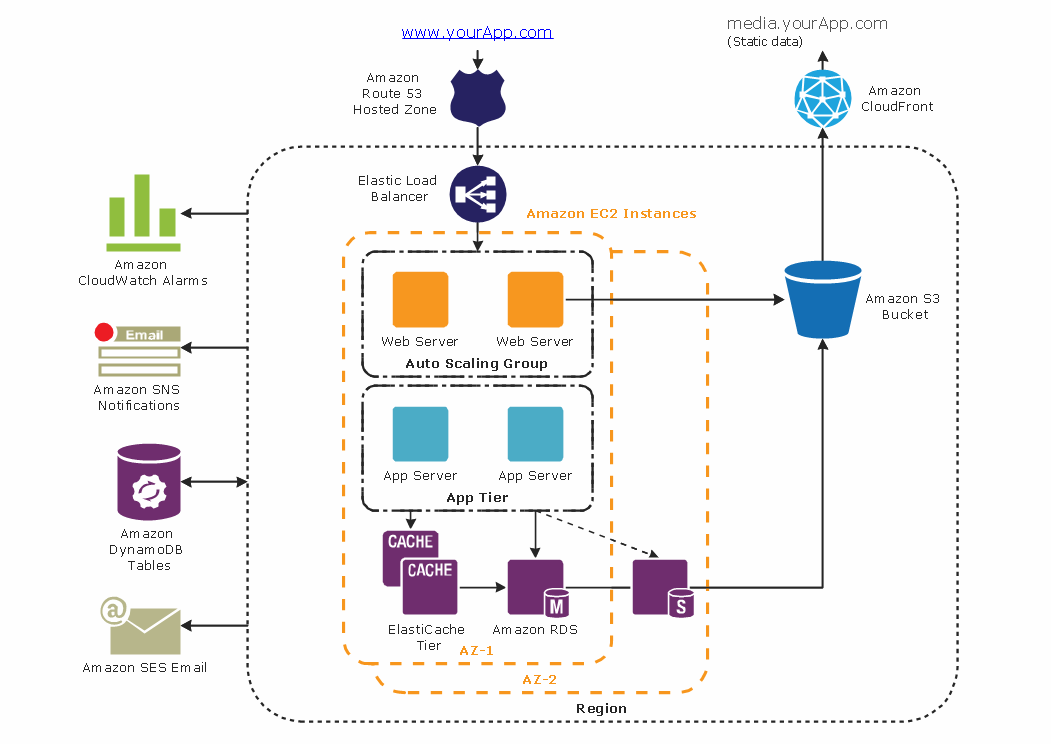
Diagramming tool - Amazon Web Services and Cloud Computing Diagrams
How to Create Presentation of Your Project Gantt Chart

Pyramid Diagram

This cycle process chart was redesigned from the Wikimedia Commons file: Business Feedback Loop PNG version.png.
"A business ideally is continually seeking feedback from customers: are the products helpful? are their needs being met? Constructive criticism helps marketers adjust offerings to meet customer needs."
[commons.wikimedia.org/ wiki/ File:Business_ Feedback_ Loop_ PNG_ version.png]
The cycle process diagram example "Business feedback loop" was created using the ConceptDraw PRO diagramming and vector drawing software extended with the Sales Flowcharts solution from the Marketing area of ConceptDraw Solution Park.
Customers feedback cycle process chart

Pyramid Diagram

SWOT Sample in Computers

- Basic Flowchart Symbols and Meaning | Radio Button Image Blue Png
- Network Layout Floor Plans | Sports Uniform Blue Png
- Blue Curved Arrow Png Multiple
- Process Flowchart | Automobiles Banking And Finance Canteen ...
- Audio - Vector stencils library | Blue Boombox Png
- Management Stakeholders Blue Png
- Arrow Blue Png
- Blue Bar Graph Png
- Crystal Blue Png
- Middle East Map In Blue Png Format
- Russia Map Blue Png
- Blue Wedding Background Design Png
- Chevron Blue Png
- Banker Icon Blue Png
- Internet Circle Logo Blue Png
- Cycle Png Blue
- Geo Map - Asia - Indonesia | Asean Png
- Arrow Updown Png
- Red Opposite Arrows Png
- People | Arrow Long Straight Gradient Png