Kanban Board Software
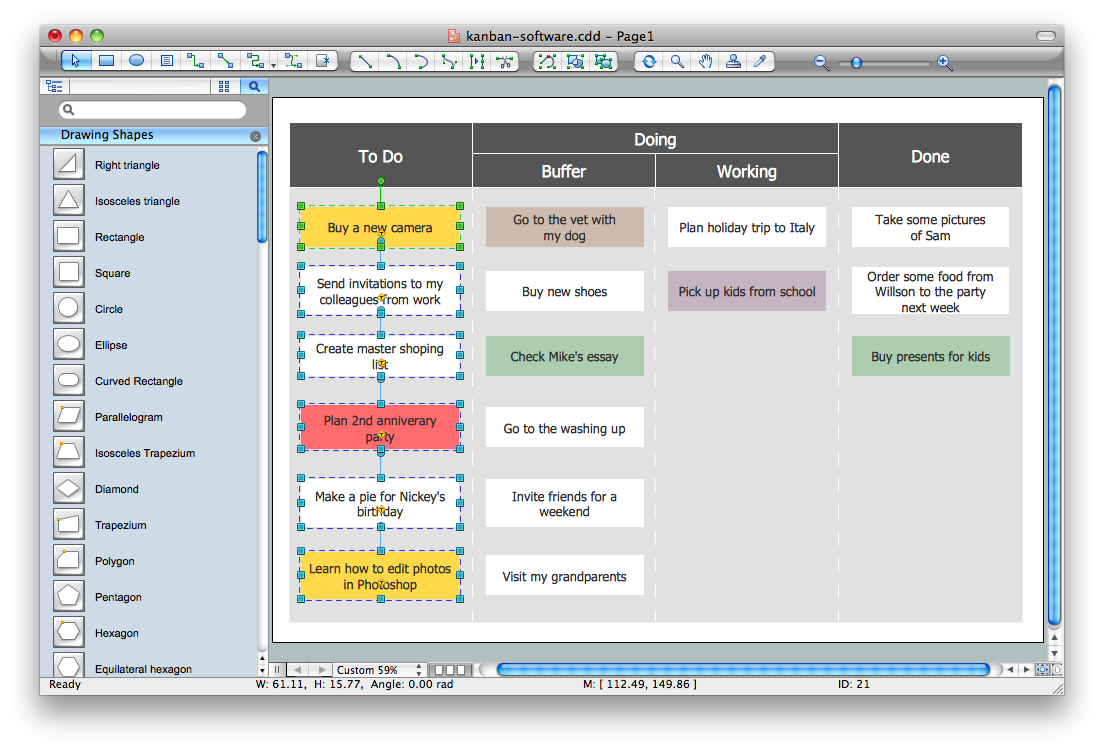
Kanban Board Software is incredibly useful tool that allows a team to work effective and productive, to analyze and improve the business processes, and visualize the workflows. ConceptDraw PRO with its numerous solutions is a powerful Kanban Board Software! Draw your own professional looking Kanban Board Diagrams quick, easy and effective with useful tools of ConceptDraw PRO diagramming and vector drawing software.Scrum board
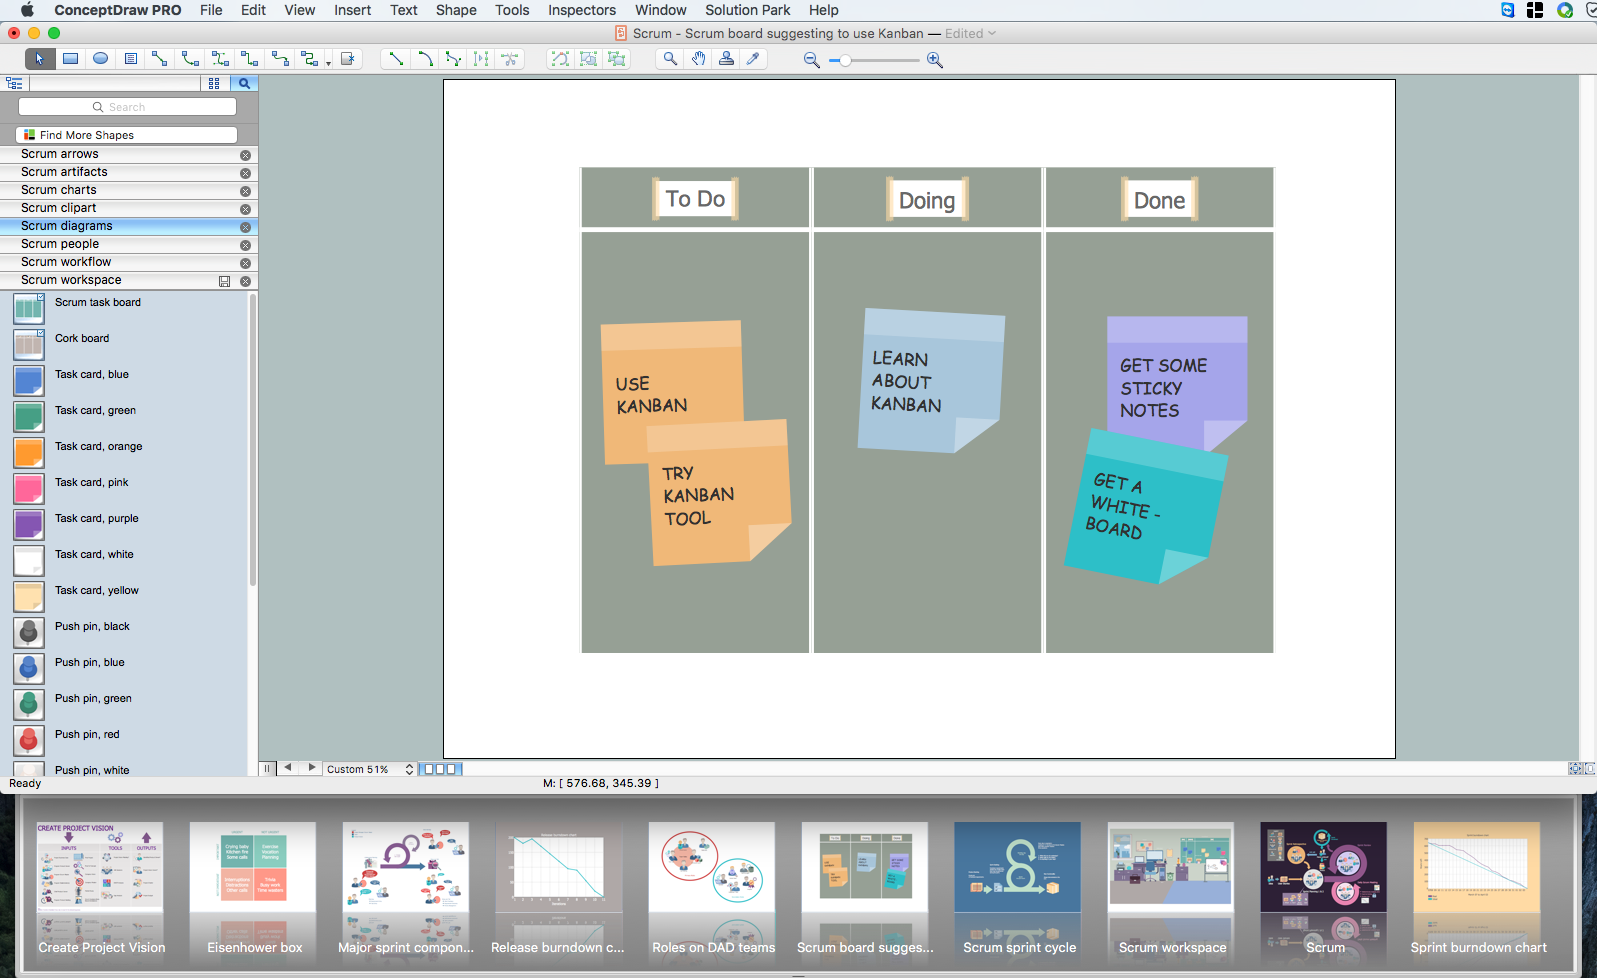
ConceptDraw diagramming and vector drawing software extended with SCRUM Workflow solution from the Project Management area of ConceptDraw Solution Park is an ideal scrum tool and powerful software for creating pictorial and professional-looking Scrum board for easy tracking the workflow, for facilitating daily synchronization and productivity improvement.Business Board Org Chart
This sample was created in ConceptDraw PRO diagramming and vector drawing software using the Organizational Charts Solution from the Software Development area of ConceptDraw Solution Park. This sample shows the organizational chart in the field of Architect Engineering. Create your own orgchart professional drawings using ConceptDraw.Scrum
What is Scrum? Scrum is the famous agile software development methodology which depicts an iterative and incremental approach for the work on the complex projects. Use ConceptDraw PRO diagramming and vector drawing software extended with SCRUM Workflow solution to draw various types of professional-looking Scrum Charts, Scrum Workflow Diagrams, Scrum Mind Maps, Scrum boards and attractive Scrum Infographics.Task Board
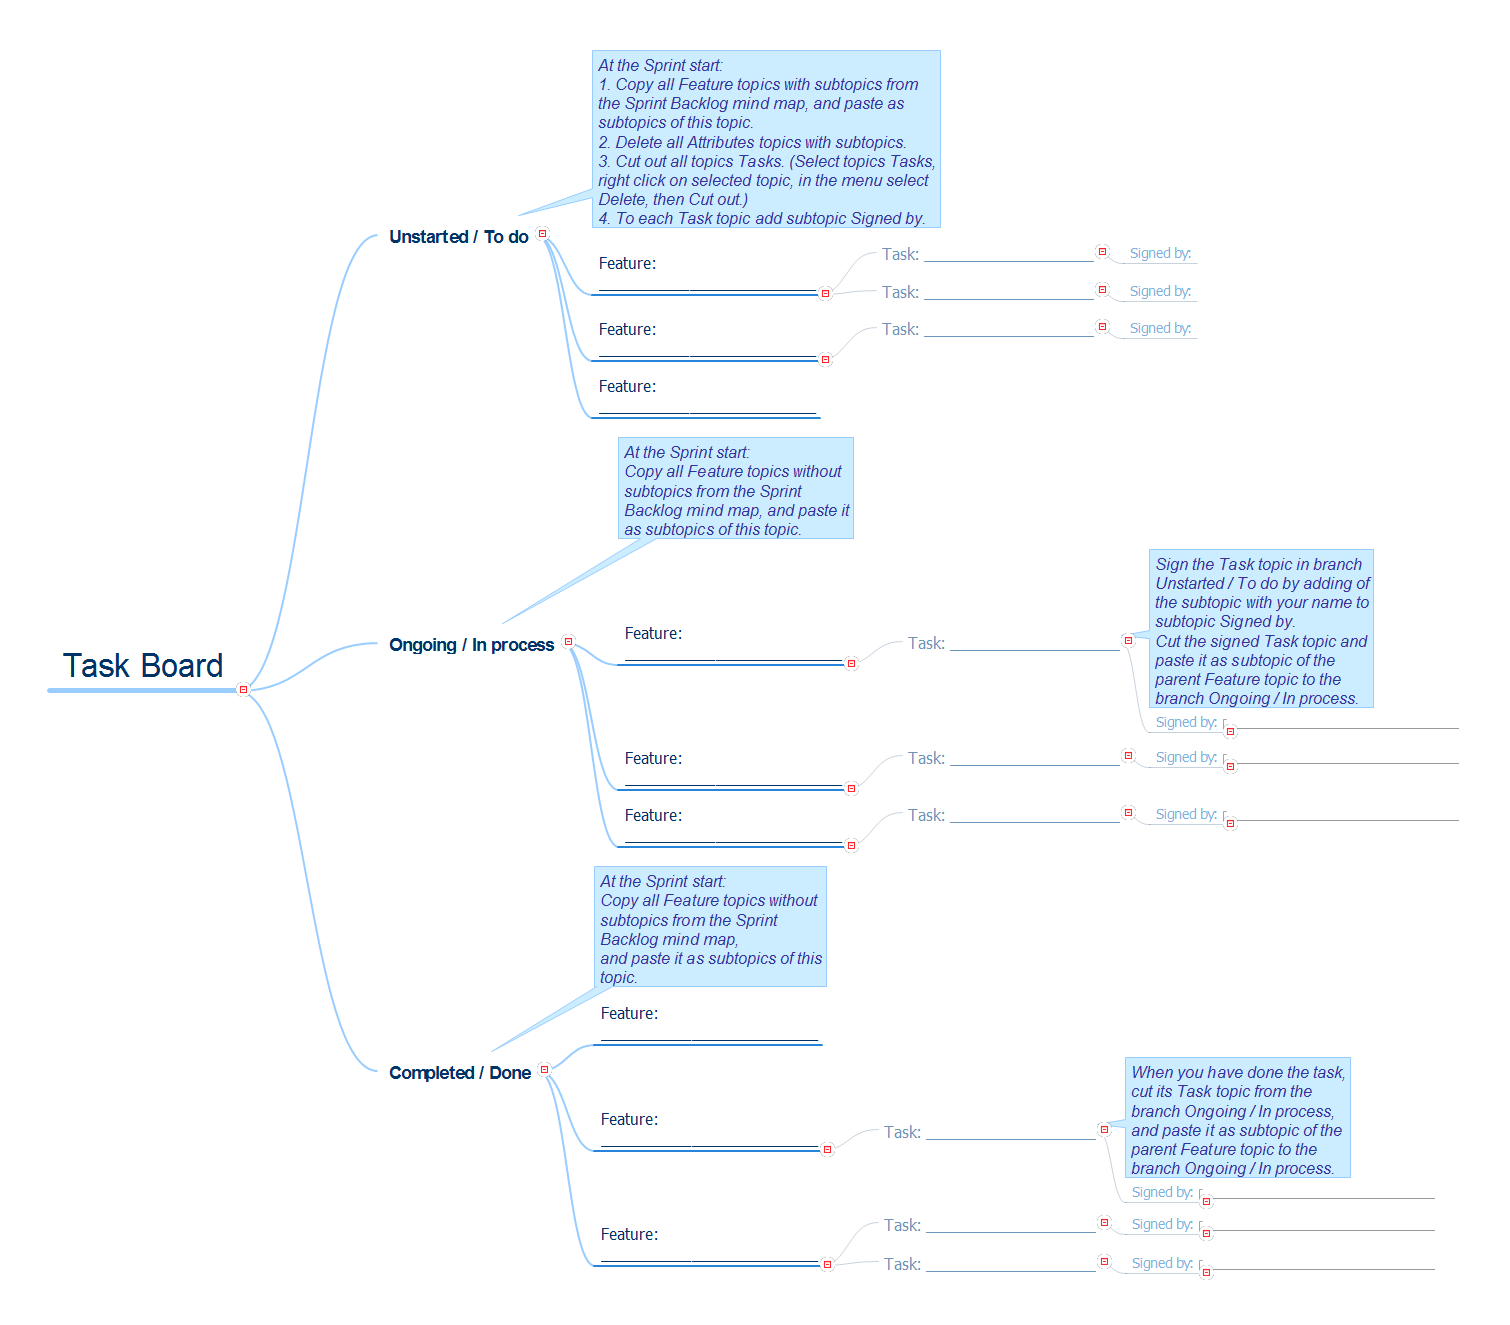
Scrum is a widely used Agile framework for completing the complex projects. Originally invented for software development teams, it is now successfully applied for any innovative scope of work and any business industry. The Task board is an integral part and the most popular tool of the Scrum method. It is a simple, but powerful tool that is usually represented as a table consisting of rows and columns. The Task board contains the columns To Do, Work In Process, To Verify, Done and the set of tasks, each task starts at the To Do column. So, each team participant can see at a glance on a Task board which tasks are currently in work and which are already completed. The Task board reflects the current status of the project and moreover lets detect the problem situations, and then take promptly the needed measures. ConceptDraw MINDMAP software offers the powerful tools to depict the Task board in a form of Mind Map, to visualize Agile management methodologies Scrum and Kanban, and their hybrid Scrum-ban.Agile Methodology
Agile methodology is an excellent alternative to waterfall and traditional sequential development. ConceptDraw PRO software extended with SCRUM Workflow solution is ideal for quick and easy designing various diagrams, charts, mind maps and schematics illustrating software development using Agile methodologies, and in particular Scrum methodology.Wiring Diagrams with ConceptDraw PRO
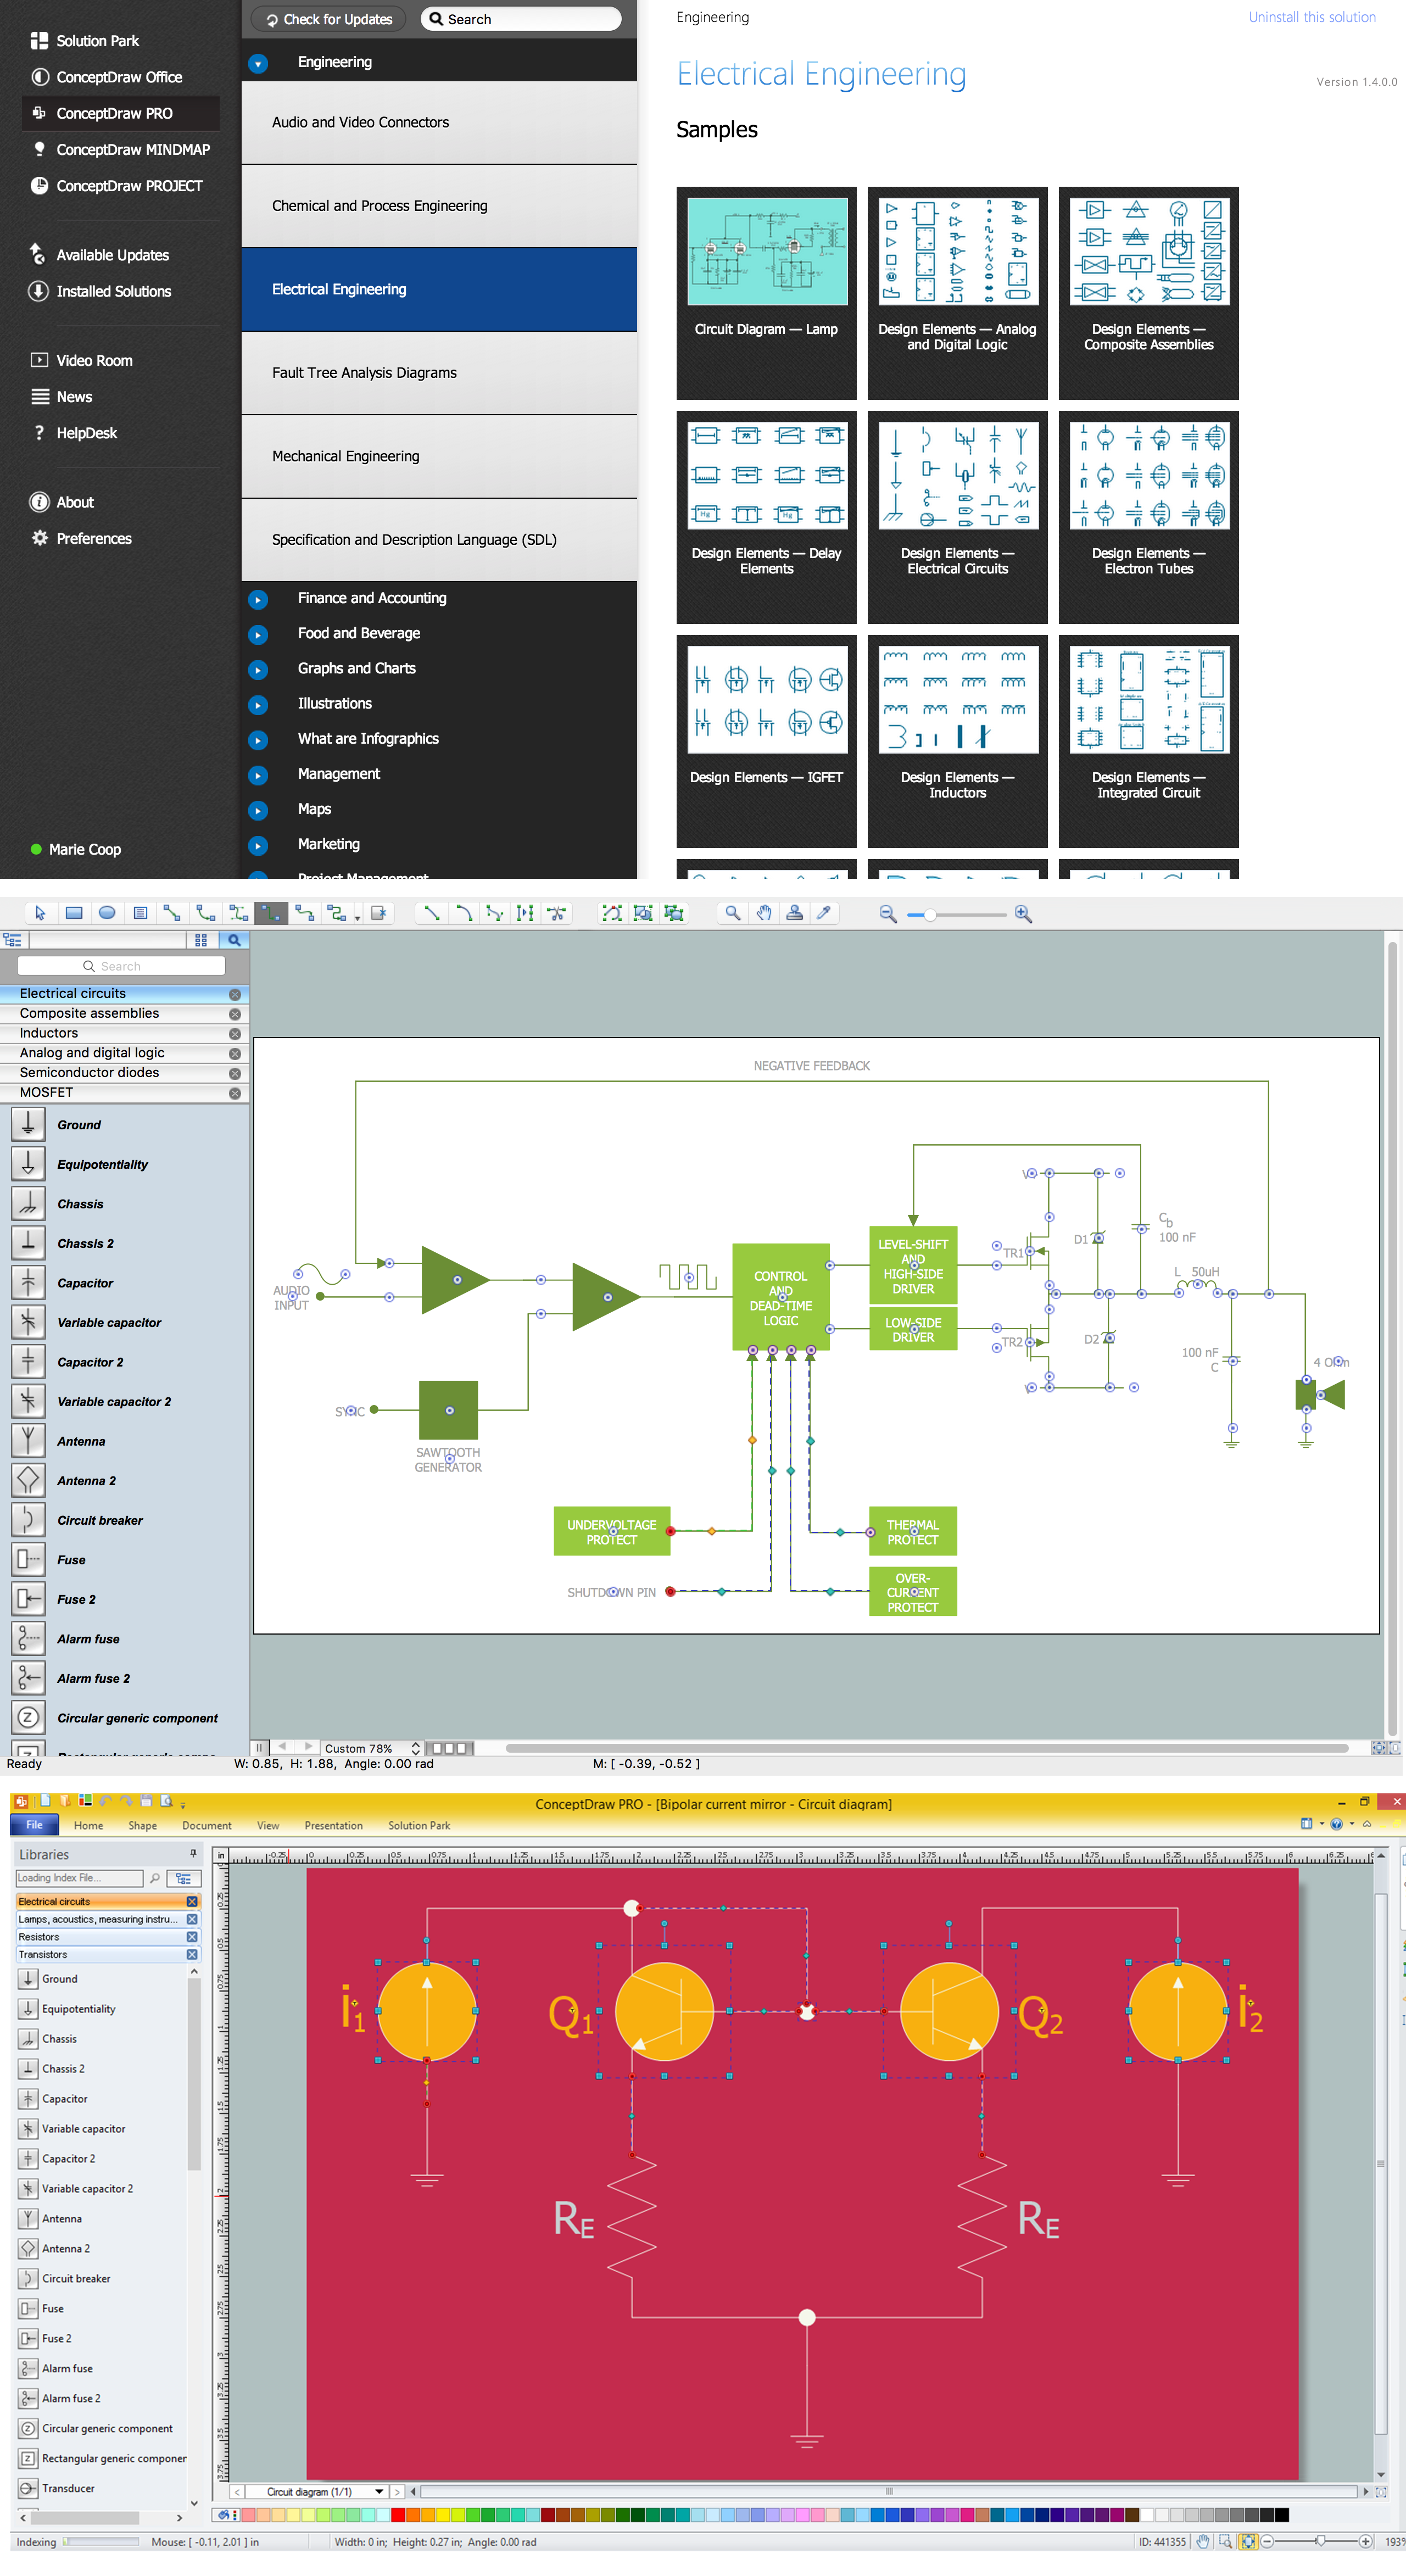
A Wiring Diagram is a comprehensive schematic that depicts the electrical circuit system, shows all the connectors, wiring, signal connections (buses), terminal boards between electrical or electronic components and devices of the circuit. Wiring Diagram illustrates how the components are connected electrically and identifies the wires by colour coding or wire numbers. These diagrams are necessary and obligatory for identifying and fixing faults of electrical or electronic circuits, and their elimination. For designing Wiring Diagrams are used the standardized symbols representing electrical components and devices. ConceptDraw Solution Park offers the Electrical Engineering solution from the Engineering area with 26 libraries of graphics design elements and electrical schematic symbols for easy drawing various Wiring Diagrams, Electrical Circuit and Wiring Blueprints, Electrical and Telecom schematics of any complexity, Electrical Engineering Diagrams, Power Systems Diagrams, Repair Diagrams, Maintenance Schemes, etc. in ConceptDraw PRO software.How To use House Electrical Plan Software
How we can conduct the electricity at house correctly without a plan? It is impossible. The House electrical diagram depicts locations of switches, outlets, dimmers and lights, and lets understand how you will connect them. But design of House Electrical Plan looks a complex task at a glance, which requires a lot of tools and special experience. But now all is simple with all-inclusive floor plan software - ConceptDraw PRO. As a house electrical plan software, the ConceptDraw PRO contains libraries with a large range of professional lighting and electrical symbols, ready-to-use electrical plans samples and examples, and built-in templates for creating great-looking Home floor electrical plans. It is a fastest way to draw Electrical circuit diagrams, Electrical wiring and Circuit schematics, Digital circuits, Electrical equipment, House electrical plans, Satellite television, Cable television, Home cinema, Closed-circuit television when are used the tools of Electric and Telecom Plans Solution from ConceptDraw Solution Park. Files created in Visio for Mac app can be easily imported to ConceptDraw PRO. Also you may import stencils and even libraries. Try for free an alternative to Visio that Apple users recommend.
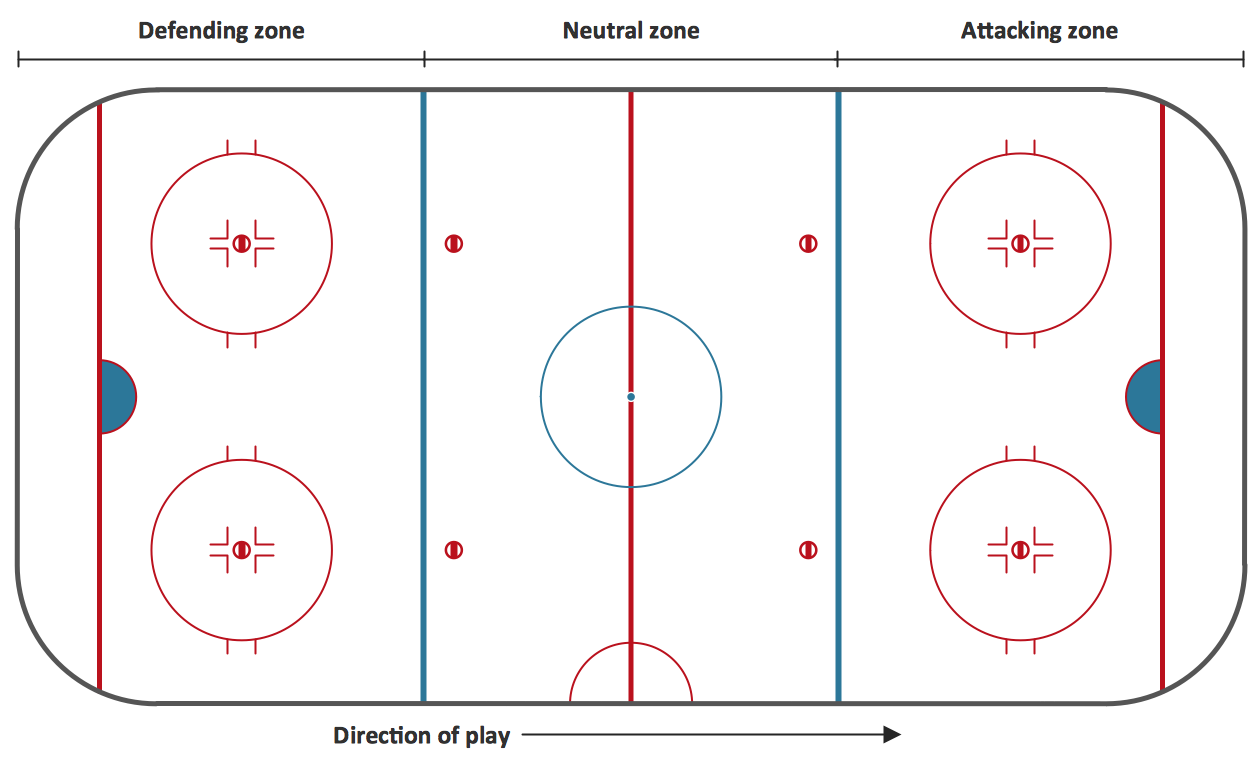
Ice Hockey Rink Diagram
The main advantage of using ConceptDraw Ice Hockey Solution is that you don't need to draw objects manually, you have all you need in libraries, templates and samples. This allows you produce professional ice hockey diagrams as quickly as possible, and then post them to blog or social media, print or present on a large screen.Quick Project Start
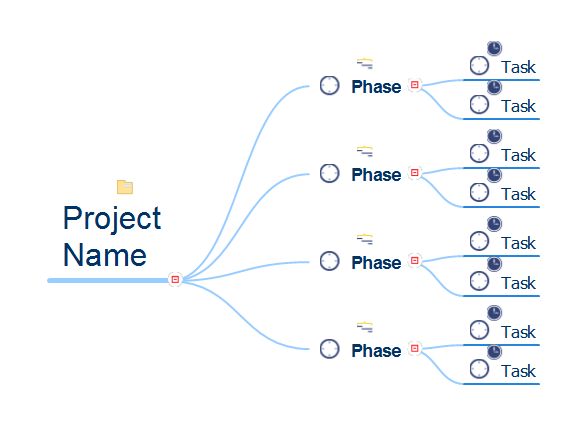
The rapid project startup and creation of initial project plan is possible and easy using effective and flexible mind mapping technique, which lets to gather requirements from your team and then plan activities in a visual mind mapping format. Using this technique you can establish time lines, delineate tasks, assign resources, and organize the overall project structure in a form of Mind Map. The ConceptDraw MINDMAP software, PM Easy solution and other offered PM solutions help in project management and support many project methodologies, including Agile and Scrum. ConceptDraw Toolbox solutions help to deal easy with common project situations, they are helpful for planning projects, tracking the milestones, events and resource usage, and for many other functions typical for project management. ConceptDraw MINDMAP software helps project managers effectively create the plan for high level tasks and milestones, set the tasks relations and dependencies, represent the project plan as a Mind Map, successfully start and realize the project of any size, and track the tasks using the ConceptDraw Project.- Network Drawing Software | Board Conection Electrical Videos ...
- Kanban Board Software | Conceptual diagram of the Kanban ...
- Kanban Board Software | Manufacturing and Maintenance | Block ...
- Cross-Functional Flowchart | Kanban Board Software | PDPC | Sign ...
- Scrum Workflow | Scrum | Scrum workflow | Kanban Board Software ...
- Kanban Board Software | Scrum board | Scrum Workflow | Kanban ...
- Kanban Board Software | Scrum board | Business people - Vector ...
- Network Drawing Software | Electronics Board Connection Video ...
- Network Drawing Software | Board Connection Electrical Video ...
