Data Flow Diagram Software
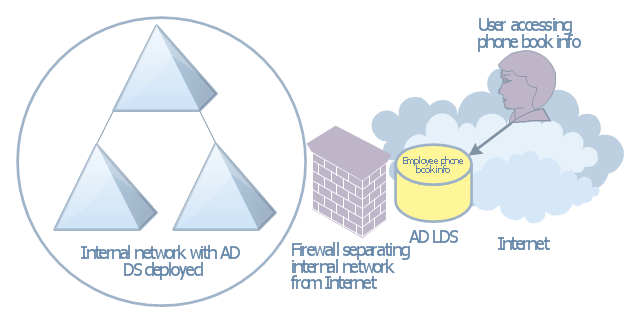
Data Flow Diagrams (DFDs) are successfully used when studying the business processes or systems that involve the transfer of data. They are a visual way to represent the data processing, to model and visualize the flow of data through a computer system and functional requirements for a designed system. They are the good business modeling tool to describe the business events and interactions, the physical systems involving the storage and transfer of data. ConceptDraw DIAGRAM supplied with Data Flow Diagrams solution from Software Development area of ConceptDraw Solution Park is a modern and powerful data flow diagram software. This solution offers large set of predesigned DFD vector objects, grouped to three libraries: Data Flow Diagrams, Gane-Sarson Notation, and Yourdon and Coad Notation. All they and also collection of DFD samples and built-in templates make a good base for ConceptDraw DIAGRAM users, providing them all conditions for easy creation the Data Flow Diagrams and Data Flow Models of any complexity.This AD diagram example was created based on the picture "AD LDS as a phone book service" from the book "Active Directory for Dummies".
"Directory services are a great way of providing information that can be fre-
quently retrieved and searched on in a hierarchical way. ... Well, there’s no reason that you can’t create a directory service that’s actually a phone book. Imagine that you need to make a searchable phone directory of your organization available on the Internet. ... This isn’t a difficult task, but it has security repercussions. If you’ve already deployed AD DS and you have the employees’ phone numbers available in that directory, it might not be a good idea to expose your AD DS environment to the Internet for security reasons. Using AD LDS is a great alternative because it can be deployed separately from AD DS and it’s designed to simply provide the information retrieval service that you need without the complications involved with Kerberos authentication and group policies." [Steve Clines and Marcia Loughry, Active Directory® For Dummies®, 2nd Edition. 2008]
The Active Directory diagram example "AD LDS as a phone book service" was created using the ConceptDraw PRO diagramming and vector drawing software extended with the Active Directory Diagrams solution from the Computer and Networks area of ConceptDraw Solution Park.
 Data Flow Diagrams (DFD)
Data Flow Diagrams solution extends ConceptDraw DIAGRAM software with templates, samples and libraries of vector stencils for drawing the data flow diagrams (DFD).
Active Directory Diagram
Active Directory (AD) is a directory management service introduced by Microsoft Corporation for Windows domain networks. This service uses the Lightweight Directory Access Protocol (LDAP) and provides quick access to the included information about large structural units such as domains, organizational units, sites, and also about simple objects, such as users names with detailed information about them - contacts information, access rights, etc. Active Directory Diagram is a representation of the network structure in clear graphical format. It is a scheme of correlations of service components with preset degree of detailed elaboration. Active Directory Diagram makes the work of network administrators with Active Directory network structure more easy and convenient, allows plan and service the network quicker and more qualitatively. The help of ConceptDraw DIAGRAM software extended with Active Directory Diagrams solution from the Computer and Networks area is indispensable for easily and quickly creation the highly detailed Active Directory Diagrams.This example was redesigned from the Wikipedia file: LastResortHotel BookRoom Process.png. [en.wikipedia.org/ wiki/ File:LastResortHotel_ BookRoom_ Process.png]
This file is licensed under the Creative Commons Attribution-ShareAlike 3.0 License. [creativecommons.org/ licenses/ by-sa/ 3.0/ ]
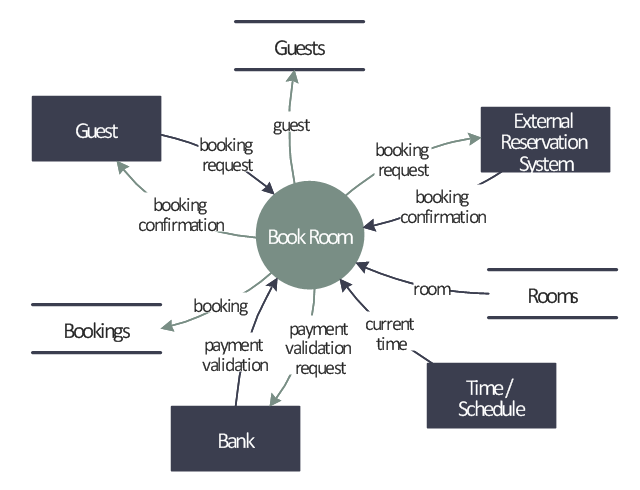
"Event partitioning is an easy-to-apply systems analysis technique that helps the analyst organize requirements for large systems into a collection of smaller, simpler, minimally-connected, easier-to-understand ‘mini systems’ / use cases. ...
Defining requirements.
Single process in a fictitious hotel using data flow diagram notation.
Single use case in a fictitious hotel using use case diagram notation.
This approach helps the analyst to decompose the system into ‘mentally bite-sized’ mini-systems using events that require a planned response. The level of detail of each response is at the level of ‘primary use cases’. Each planned response may be modelled using DFD notation or as a single use case using use case diagram notation.
The basic flow within a process or use case can usually be described in a relatively small number of steps, often fewer than twenty or thirty, possibly using something like ‘structured English’. Ideally, all of the steps would be visible all at once (often a page or less). The intention is to reduce one of the risks associated with short-term memory, namely, forgetting what is not immediately visible (‘out of sight, out of mind’). ...
Single process in a fictitious hotel using data flow diagram notation." [Event partitioning. Wikipedia]
The DFD example "Last resort hotel book room process" was created using the ConceptDraw PRO diagramming and vector drawing software extended with the Data Flow Diagrams solution from the Software Development area of ConceptDraw Solution Park.
Small Office Design
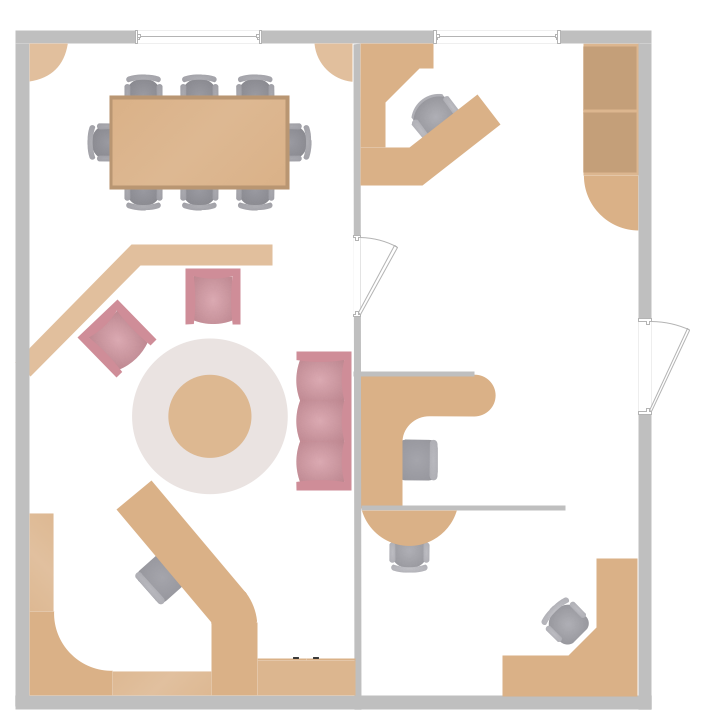
Office design must to be well thought-out. It is especially important for the small offices, where each detail is in sight. ConceptDraw DIAGRAM software offers you the Office Layout Plans Solution from the Building Plans Area for quick and easy creating detailed Small Office Design plans.This vector stencils library contains 195 cloud computing icons.
Use it to design cloud computing infographic and diagrams with ConceptDraw PRO software.
"Cloud computing, also on-demand computing, is a kind of Internet-based computing that provides shared processing resources and data to computers and other devices on demand. It is a model for enabling ubiquitous, on-demand access to a shared pool of configurable computing resources (e.g., networks, servers, storage, applications and services), which can be rapidly provisioned and released with minimal management effort. Cloud computing and storage solutions provide users and enterprises with various capabilities to store and process their data in third-party data centers.
Cloud computing has become a highly demanded service or utility due to the advantages of high computing power, cheap cost of services, high performance, scalability, accessibility as well as availability." [Cloud computing. Wikipedia]
The vector stencils library "Cloud clipart" is included in the Cloud Computing Diagrams solution from the Computer and Networks area of ConceptDraw Solution Park.
This hotel computer reservations system cycle process chart example was redesigned from the Wikimedia Commons file: По-запросу.jpg.
[commons.wikimedia.org/ wiki/ File:По-запросу.jpg]
"A computer reservations system or central reservation system (CRS) is a computerized system used to store and retrieve information and conduct transactions related to air travel, hotels, car rental, or activities. ...
Modern GDSes typically allow users to book hotel rooms, rental cars, airline tickets as well as activities and tours." [en.wikipedia.org/ wiki/ Computer_ reservations_ system]
The cycle process diagram example "Hotel reservation system" was created using the ConceptDraw PRO diagramming and vector drawing software extended with the Sales Flowcharts solution from the Marketing area of ConceptDraw Solution Park.
Diagramme Zeichnen
No need for any special drawing skills to create professional looking diagrams outside of your knowledge base. ConceptDraw DIAGRAM takes care of the technical details, allowing you to focus on your job, not the drawing.Root Cause Analysis
The Seven Management and Planning Tools is a tool for Root Cause Analysis Tree Diagram drawing. This diagram is for Root Cause Analysis. Analyze the root causes for factors that influenced the problem. This diagram is constructed separately for each highly prioritized factor. The goal of this is to find the root causes for the factor and list possible corrective action.
- Hotel Network Topology Diagram | Hotel Plan. Hotel Plan Examples ...
- Last resort hotel book room process - DFD | IDEF4 Standard ...
- Design Element: Rack Diagram for Network Diagrams | Flowcharts ...
- Last resort hotel book room process - DFD | IDEF4 Standard | Data ...
- Last resort hotel book room process - DFD | Data Flow Diagrams ...
- Hotel Plan. Hotel Plan Examples | Local area network (LAN ...
- Hotel Network Topology Diagram | Hotel Service Process | Hotel ...
- Billing In Hotel Process Flow Chart
- Firewall between LAN and WAN | Network Security | AD LDS as a ...
- Hotel Wireless Networking Proposal


-cloud-clipart---vector-stencils-library.png--diagram-flowchart-example.png)
-cloud-clipart---vector-stencils-library.png--diagram-flowchart-example.png)


-cloud-clipart---vector-stencils-library.png--diagram-flowchart-example.png)


-cloud-clipart---vector-stencils-library.png--diagram-flowchart-example.png)
-cloud-clipart---vector-stencils-library.png--diagram-flowchart-example.png)


