HelpDesk
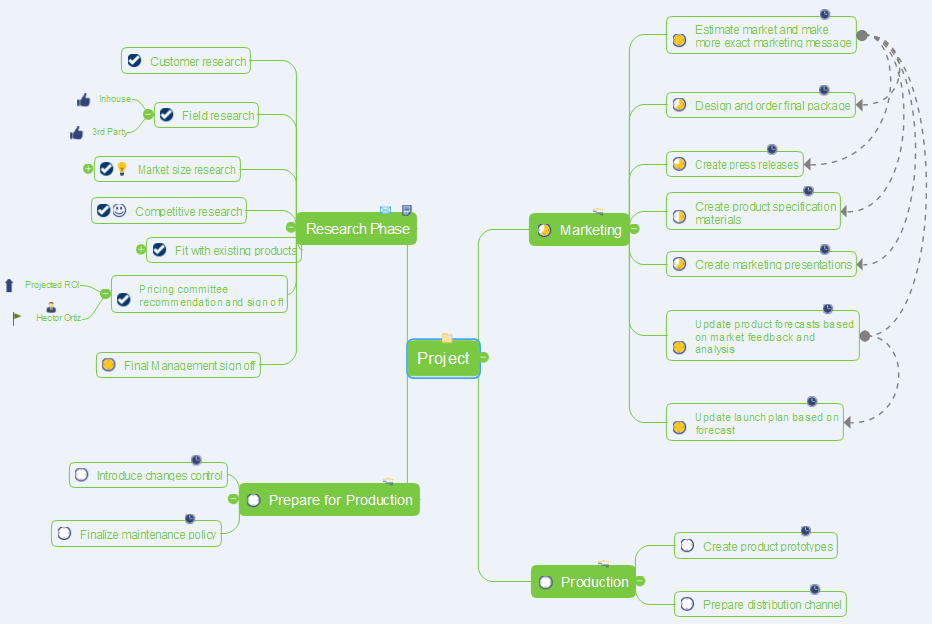
How to Make a Project Tasks Mind Map from Brainstorm
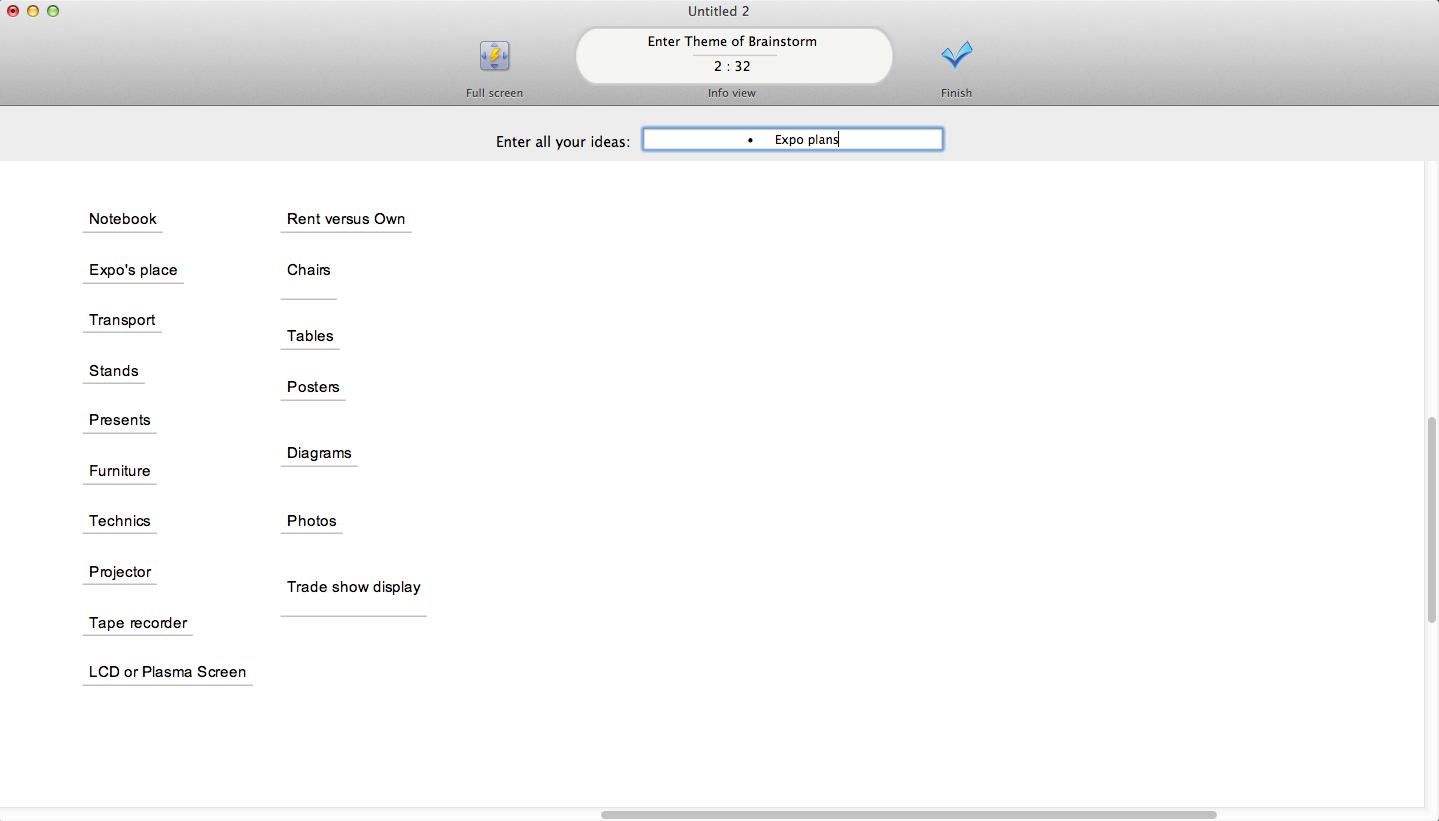
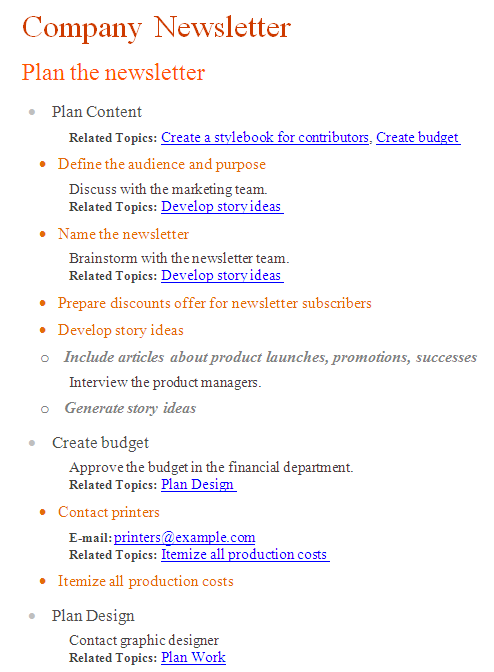
Start project with creating a mind map, structuring ideas captured during a brainstorming session.
Brainstorm Exchanging Mind Maps with Evernote
You will be able to use a Note Exchange solution to share mindmaps and mindmap data across your entire organization. It has never been easier to run brainstorm ideas for building strategies.Product Overview
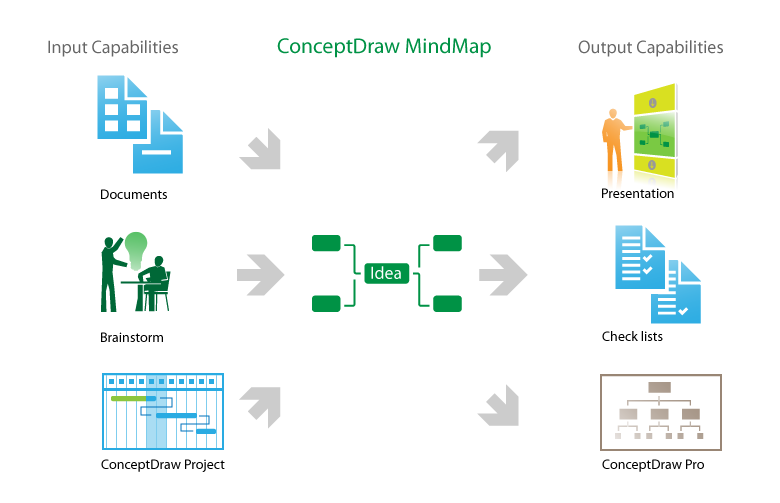
The role of ConceptDraw MINDMAP is to organize and plan idea development and communicate between process participants. Mind maps are convenient to prepare presentations for team and management and send task lists and related information.Brainstorming in ConceptDraw MINDMAP
Video tutorials on ConceptDraw products. Try it today!Brainstorming Software
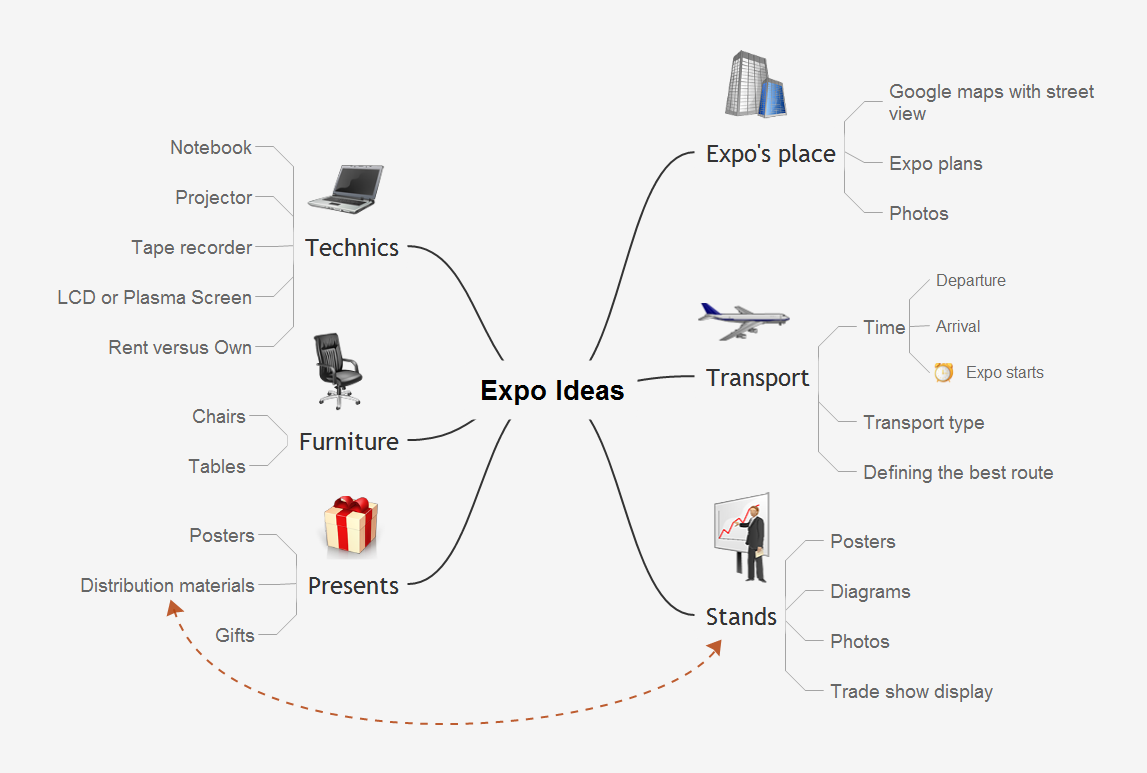
Brainstorming is an effective and widely used tool for generating large quantity of ideas by group of people in a short time. ConceptDraw MINDMAP is a powerful brainstorming software! ConceptDraw MINDMAP lets you easy and effectively generate and organize ideas and data, and also create the illustrative mind maps.ConceptDraw MINDMAP: Brainstorming, Mind Mapping for macOS and Windows
ConceptDraw MINDMAP is a powerful business and personal productivity software application that provides visual organization and access to information for individuals and organizations.Remote Learning Sessions - Webinars
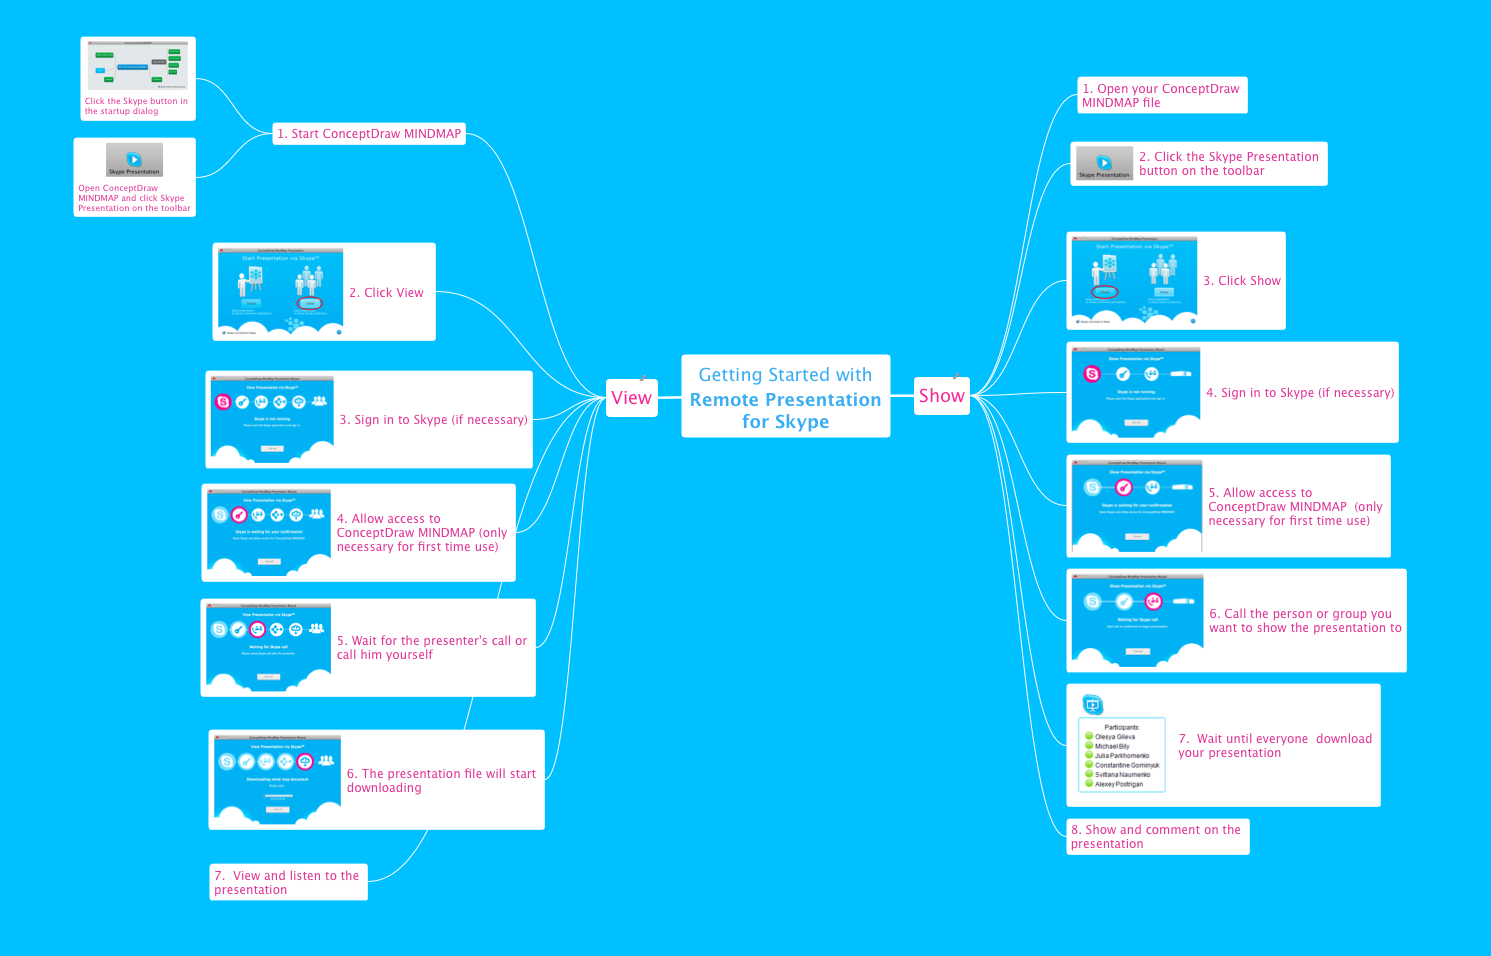
A perfect visual tool for presenting to a remote group via Skype. Participants receives document automatically. Participants are able to edit presentation after session. Helpful for webinars, online meetings, remote learning.
Cause and Effect Analysis
When you have some problems you need first to explore the reasons which caused them. Cause and Effect Analysis is a perfect way to do this. ConceptDraw PRO software enhanced with Fishbone Diagrams solution from the Management area of ConceptDraw Solution Park gives the ability to draw fast and easy Fishbone diagram that identifies many possible causes for an effect.
 PM Meetings
This solution extends ConceptDraw MINDMAP software, by making meeting preparation a quick and simple task.
 Marketing
This solution extends ConceptDraw PRO v9 and ConceptDraw MINDMAP v7 with Marketing Diagrams and Mind Maps (brainstorming, preparing and holding meetings and presentations, sales calls).
Idea Outline
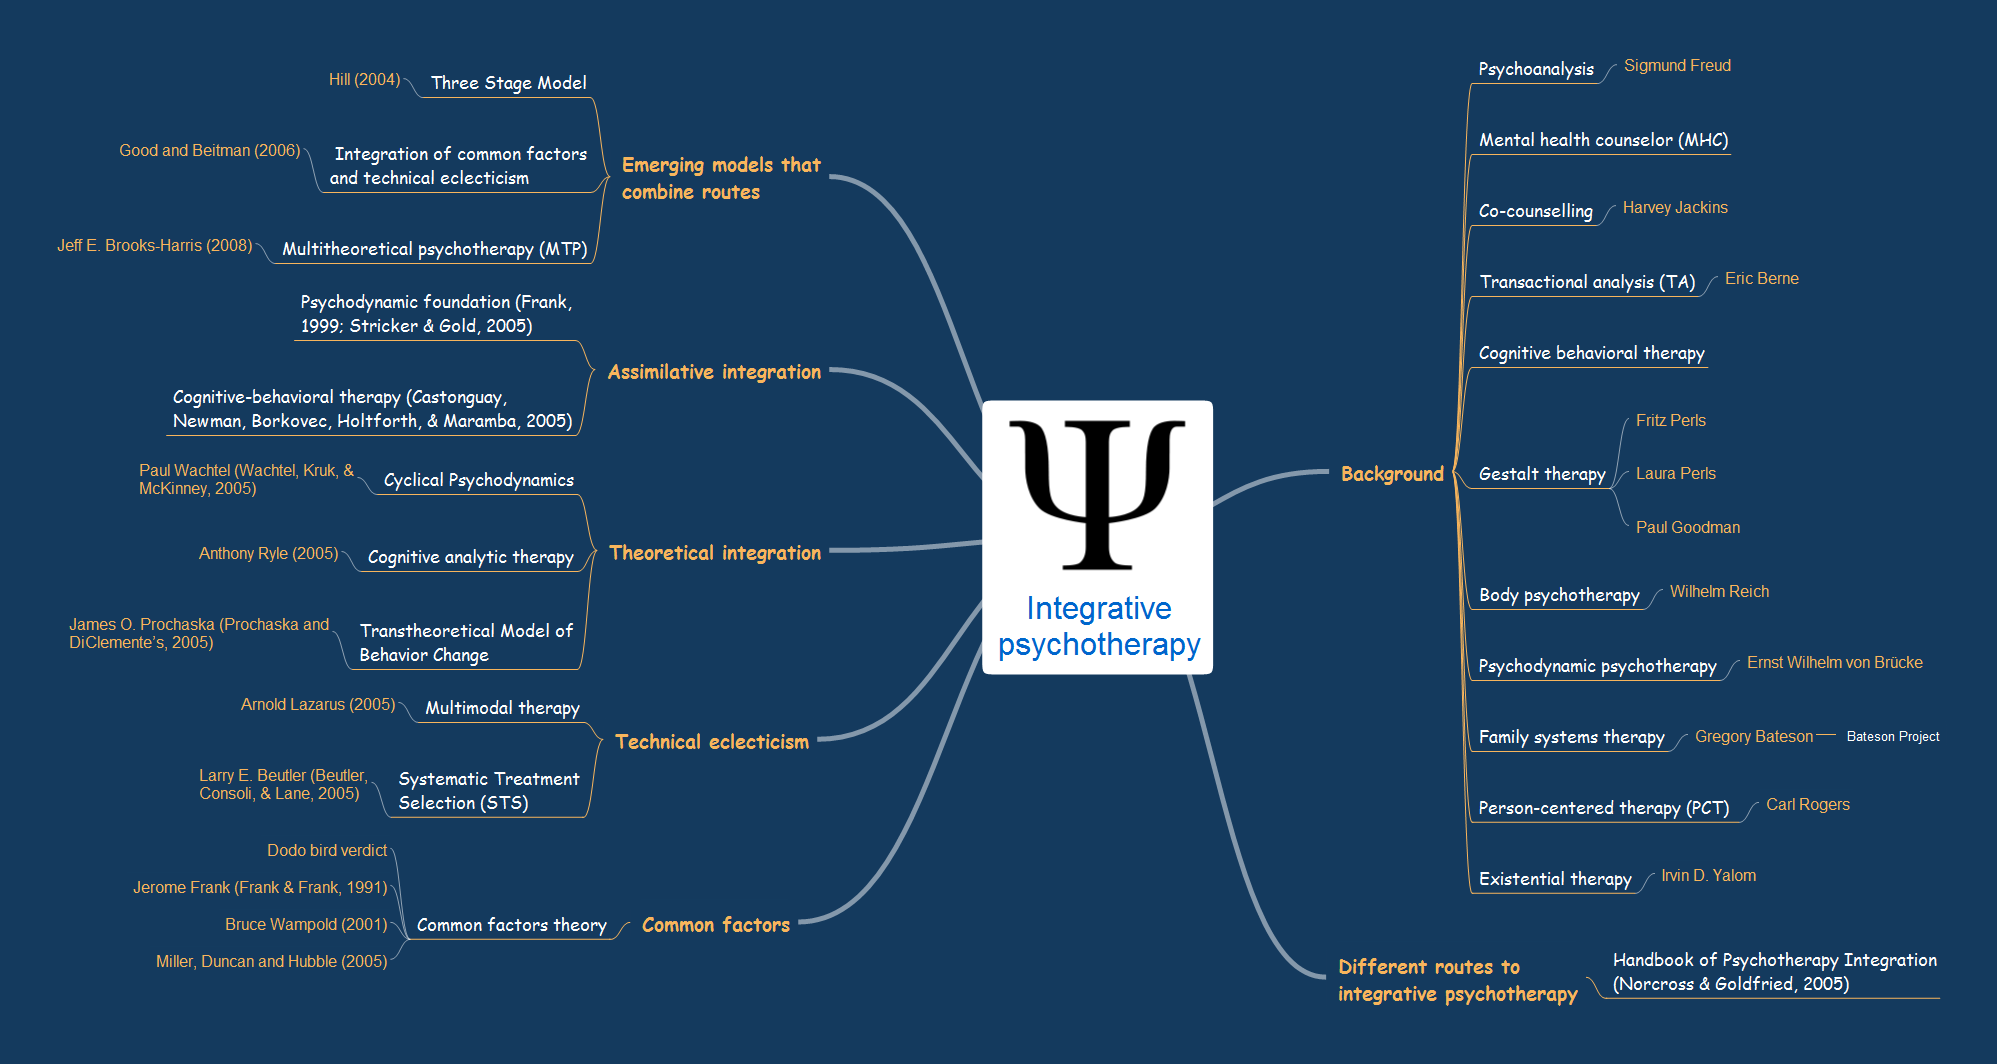
ConceptDraw MINDMAP is a powerful brainstorming software, the best application for ideas communication, for outlining ideas and data, for organizing arguments and other information. ConceptDraw MINDMAP software and solutions offered by ConceptDraw Solution Park help to hold the brainstorming session, to brainstorm a lot of new ideas, to outline your ideas, to make the Mind Map from the new ideas and concepts, to show new ideas at the presentation, efffectively communicate them and report at the meetings and conferences. The good ideas outline saves your time and helps visually explain your ideas for other people. Outline effectively your ideas using varied tools offered by ConceptDraw MINDMAP and make sure that it is very easy. The wide export capabilities of ConceptDraw MINDMAP are also helpful for ideas communication and collaboration with colleagues which don't have installed ConceptDraw Office applications. You can create automatically the MS PowerPoint presentation or MS Word document from the content of the active page of your map with a simple click.Relations Diagram
The Relations Diagram is used to identify how the factors influence each other, to determine what factors are causes and what are effects. The factors mostly influencing are called “drivers”, the primarily affected factors are “indicators”. The problem solving is focused on the change of "drivers" factors by applying the corrective actions. The "indicators" factors help establish the Key Performance Indicators (KPIs) to monitor the changes and also define the effectiveness of the corrective actions in resolving a problem. ConceptDraw MINDMAP software ideally suits for designing Relations Diagrams. The easiest way to create the MINDMAP Relations Diagram, is to use the included Relations Diagram input template. Open it in ConceptDraw MINDMAP application from the Input tab and hold a new brainstorming session, identify the central issue and the contributing factors to this issue. Click the Finish Brainstorm button to generate a Mind Map and begin the further work with it, or select Relations Diagram item from the Output tab to automatically draw it in ConceptDraw PRO application.SWOT Analysis
When starting a new business project or business venture and making the strategic decisions, you need to attach all strengths, utilize all opportunities to eliminate weaknesses and to avoid potential threats. All these actions look like hard, but it is not so when is applied a SWOT Analysis method. The main goal of this method is to help develop a strong business strategy, its major tools are SWOT Matrix and SWOT Mind Map that help you define the internal strengths and weaknesses, and also external opportunities and threats that you may face. The Mind Map is a unique visual tool, which lets you see immediately the key points and gaps, and to establish the links between seemingly unrelated information. ConceptDraw MINDMAP software is effective to save your time and efforts when carrying out a SWOT Analysis. The SWOT and TOWS Matrix Diagrams solution, that is available from ConceptDraw Solution Park, contains easy-to-use Mind Map templates to help you identify the Strengths, Weaknesses, Opportunities, and Threats, and represent the SWOT analysis results on the professionally-looking Mind Map.How To Collaborate via Skype
Online collaboration tool for workgroups that extends Skype conference call possibilities. This professional solution makes meetings more powerful and discussions more lively. Great way to engage your audience.
Affinity Diagram
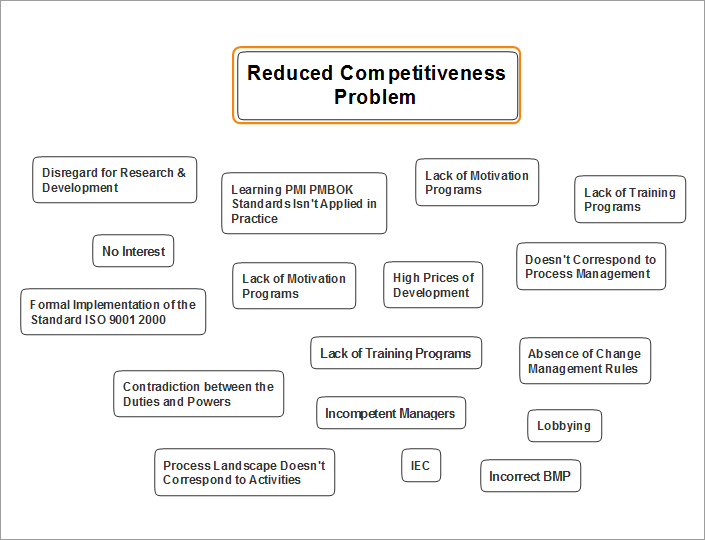
The Affinity Diagram, also known as a KJ diagram, is a business tool invented for organization the large quantity of ideas and data. It is a part of Seven Management and Planning Tools, it is usually used right after brainstorming to sort large numbers of ideas into the corresponding groups. The Affinity Diagram helps to represent in a better way the structure of large and complex factors which influence on a problem, divides these factors into the smaller and simpler structures, and helps team members to see the patterns and identify possible solutions to problems they have. The diagrams of this type don't show the causal relationships between the factors, but they are designed to prepare the data for holding further analysis of the cause-effect relationships. Another area of Affinity Diagram usage is contextual inquiry as a way to sort observations and notes from field interviews, support call logs, open-ended survey responses organizing, etc. ConceptDraw MINDMAP software offers you the tools for easy holding brainstorming, generation ideas and creation MINDMAP Affinity Diagram.- How to Make a Project Tasks Mind Map from Brainstorm | How to ...
- How to Brainstorm with ConceptDraw MINDMAP | Brainstorming in ...
- Brainstorming Ideas About Soccer
- Brainstorming Diagrams
- Brainstorming Chart Template
- How to Make a Project Tasks Mind Map from Brainstorm | How to ...
- How to Brainstorm with ConceptDraw MINDMAP | Brainstorming ...
- Brainstorm Exchanging Mind Maps with Evernote | How To Create ...
- Brainstorming Flowchart Of Weather Update
- How to Make a Project Tasks Mind Map from Brainstorm | How to ...
- How to Make a Project Tasks Mind Map from Brainstorm | How To ...
- Soccer Football Brainstorming
- Process Flowchart | ConceptDraw MINDMAP: Brainstorming , Mind ...
- Diagram Of Brainstorming
- Create Brainstorming Diagram
- Brainstorming Bubble Chart Images
- Mind Mapping Software | Brainstorming Software | How to ...
- Brainstorming Bubble
- Brainstorming Diagram Template
