How To Create a Bubble Chart
Bubble diagrams solution extends ConceptDraw DIAGRAM software with templates, Using ConceptDraw Connectors, you can create a bubble chart in moments. Using ConceptDraw you will be able to create a bubble chart from the ready ConceptDraw library objects or make your own objects. The created diagram can represent ideas organization, in brainstorming processes, by teachers for explaining difficult ideas or for presentations.Idea Outline
ConceptDraw MINDMAP is a powerful brainstorming software, the best application for ideas communication, for outlining ideas and data, for organizing arguments and other information. ConceptDraw MINDMAP software and solutions offered by ConceptDraw Solution Park help to hold the brainstorming session, to brainstorm a lot of new ideas, to outline your ideas, to make the Mind Map from the new ideas and concepts, to show new ideas at the presentation, efffectively communicate them and report at the meetings and conferences. The good ideas outline saves your time and helps visually explain your ideas for other people. Outline effectively your ideas using varied tools offered by ConceptDraw MINDMAP and make sure that it is very easy. The wide export capabilities of ConceptDraw MINDMAP are also helpful for ideas communication and collaboration with colleagues which don't have installed ConceptDraw Office applications. You can create automatically the MS PowerPoint presentation or MS Word document from the content of the active page of your map with a simple click.Food Pictures
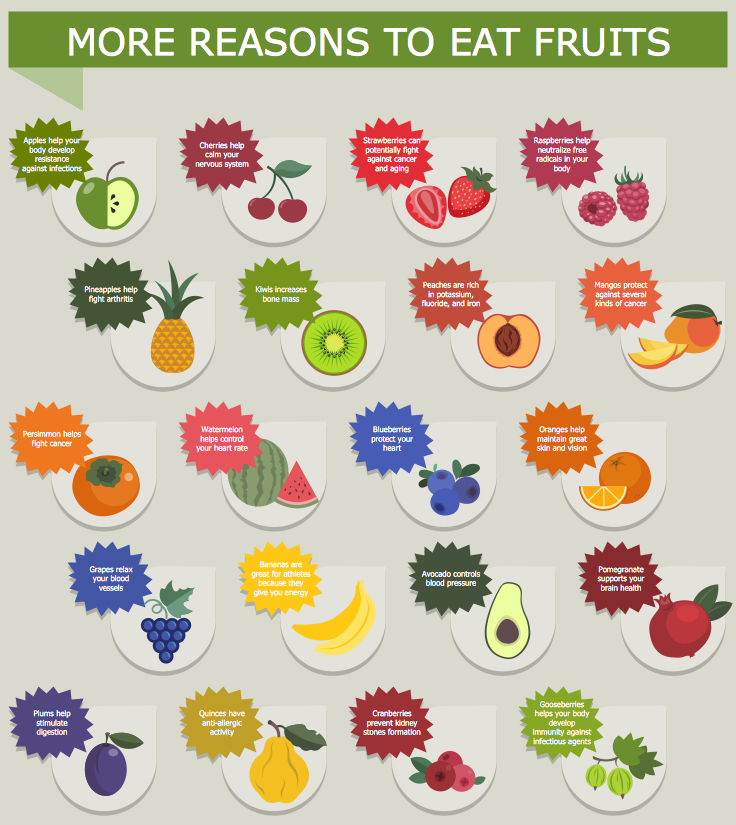
One of the key roles at the attracting visitors in catering establishments of different formats plays their visual solution, design of advertising elements of fast foods and restaurants. ConceptDraw DIAGRAM software enhanced with unique Food Court solution from the Food and Beverage area of ConceptDraw Solution Park allows to design inviting and attractive signboards, pictorial menus with appetizing food pictures.Bubble Charts
Bubble Charts are convenient way to visualize ideas and concepts by organizing them in a hierarchy. To show the importance of ideas you can use different bubble sizes and colors. ConceptDraw DIAGRAM diagramming and vector drawing software extended with Bubble Diagrams Solution from the "Diagrams" Area affords you the easiest and fastest way for designing professional looking Bubble Charts.Bubble Chart Maker
ConceptDraw DIAGRAM diagramming and vector drawing software extended with Bubble Diagrams Solution from the "Diagrams" Area is a powerful Bubble Chart Maker.Geo Map - Africa - Algeria
Algeria, officially The People's Democratic Republic of Algeria, is a country in the Maghreb region of North Africa on the Mediterranean coast. The vector stencils library Algeria contains contours for ConceptDraw DIAGRAM diagramming and vector drawing software. This library is contained in the Continent Maps solution from Maps area of ConceptDraw Solution Park.Competitor Analysis
Competitor analysis is a first and obligatory step in elaboration the proper corporate marketing strategy and creating sustainable competitive advantage. Use powerful opportunities of numerous solutions from ConceptDraw Solution Park for designing illustrative diagrams, charts, matrices which are necessary for effective competitor analysis.Modern Garden Design
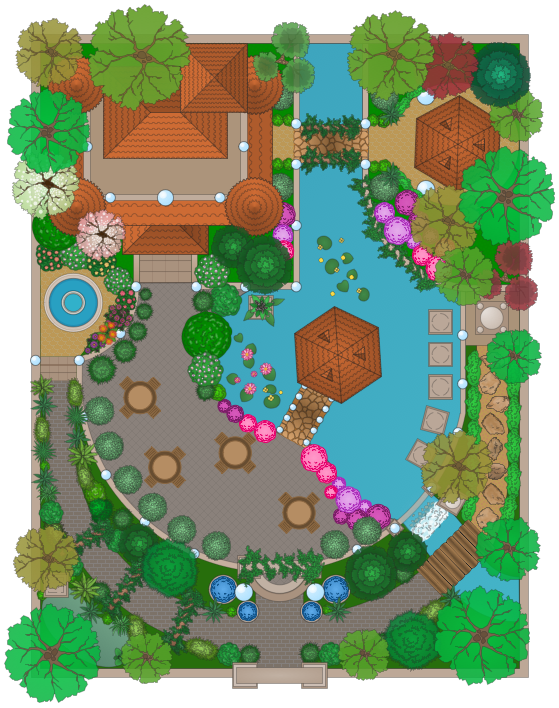
The modern garden design is a full complex of works for design, decorating and gardening. Landscape design offers a large number of styles for the modern garden design, their origins go back centuries. But do not forget that the modern garden design is first of all an individual project for a specific landscape and specific owner of the land, and sometimes it is appropriate to apply the combination of styles. ConceptDraw DIAGRAM diagramming and vector drawing software offers the unique Landscape & Garden Solution from the Building Plans area for effective development the modern garden design.Exam Preparation Mind Map
Mind Map is a way to effectively visualize the complex knowledge, to simplify and accelerate the learning and teaching processes. In this way Mind Maps are always in demand in a lot of spheres, among them business, education, engineering, software development, and many others. Mind Maps are perfect for illustration the documents, reports, textbooks, websites, education materials, lectures, etc. The ConceptDraw MINDMAP professional software from ConceptDraw Office suite provides a lot of powerful tools for brainstorming and designing colorful and attractive Mind Maps, drawings and charts, which ideally suit for structuring information and its representation in a visual and comprehensive form. To prepare effectively for examination, you need organize yourself and also clearly understand the correct sequence of actions. This Mind Map created in ConceptDraw MINDMAP application illustrates the main items during the exam preparation process. The use of predesigned cliparts lets to make your Mind Maps illustrative, colorful and attractive.ConceptDraw MINDMAP : Brainstorming, Mind Mapping for macOS and Windows
ConceptDraw MINDMAP is a powerful business and personal productivity software application that provides visual organization and access to information for individuals and organizations.Positioning Map
ConceptDraw DIAGRAM is a powerful diagramming and vector drawing software. Extended with Matrices Solution from the Marketing Area of ConceptDraw Solution Park it became the best software for quick and easy designing various types of Matrix Diagrams, including Positioning Map.Mac Compatible Remote Presentation
Mac compatible remote presentation, A simple way to share your presentation remotely via Skype. All participants receive presentation file.
Diagrams Mean Nothing
You are probably familiar with diagrams. But have you ever thought that they are useless? This article will explain you why.Affinity Diagram Software
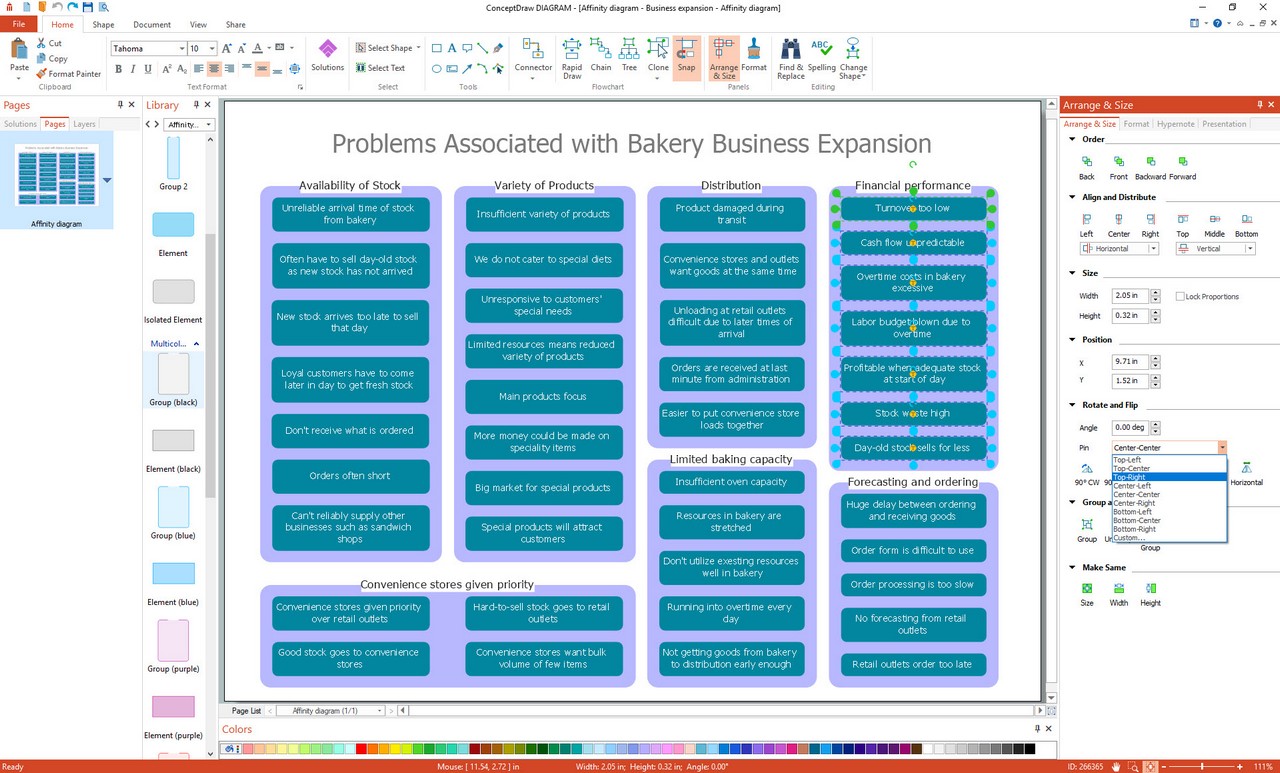
Affinity Diagram Software - ConceptDraw DIAGRAM is a powerful diagramming and vector drawing software that allows quick, easy and effective create the Affinity Diagrams. Seven Management and Planning Tools solution from the Business Productivity area of ConceptDraw Solution Park provides templates, samples and ready-to-use vector stencils that will help you design the professional looking Affinity Diagrams in a few moments.Examples of Flowcharts, Org Charts and More
ConceptDraw DIAGRAM covers a broad spectrum of business graphics categories and offers at ConceptDraw STORE enormous online collection of pictorial examples and samples for different thematics and application areas. It is a plentiful source of inspiration and wonderful examples of professionally designed diagrams, flowcharts, UML diagrams, organizational charts, databases, ERDs, network diagrams, business charts, different thematic charts, schematics, infographics and plans developed specially for knowledge workers, engineers, managers, businessmen, marketing specialists, analytics, scientists, students, professors, journalists and also for a large number of other people that every day use various diagrams and drawings in their work and life activity. Each of these examples is a real art, all they are well thought-out and designed without efforts with help of powerful tools of ConceptDraw DIAGRAM software. ConceptDraw examples display all variety of tasks, possibilities and results that ConceptDraw Product Line lets achieve fast and easy. ConceptDraw is one of the best Visio alternatives for Mac. It open all Visio formats like.vsdx,.vss,.vdx files and allows you to export files to Visio formats.
Best Multi-Platform Diagram Software
ConceptDraw DIAGRAM is a powerful tool for drawing business communication ideas and concepts, simple visual presentation of numerical data in the Mac environment.Bubble diagrams in Landscape Design with ConceptDraw DIAGRAM
Bubble Diagrams are the charts with a bubble presentation of data with obligatory consideration of bubble's sizes. They are analogs of Mind Maps and find their application at many fields, and even in landscape design. At this case the bubbles are applied to illustrate the arrangement of different areas of future landscape design, such as lawns, flowerbeds, playgrounds, pools, recreation areas, etc. Bubble Diagram helps to see instantly the whole project, it is easy for design and quite informative, in most cases it reflects all needed information. Often Bubble Diagram is used as a draft for the future landscape project, on the first stage of its design, and in case of approval of chosen design concept is created advanced detailed landscape plan with specification of plants and used materials. Creation of Bubble Diagrams for landscape in ConceptDraw DIAGRAM software is an easy task thanks to the Bubble Diagrams solution from "Diagrams" area. You can use the ready scanned location plan as the base or create it easy using the special ConceptDraw libraries and templates.Example of DFD for Online Store (Data Flow Diagram)
Data Flow Diagram (DFD) is a methodology of graphical structural analysis and information systems design, which describes the sources external in respect to the system, recipients of data, logical functions, data flows and data stores that are accessed. DFDs allow to identify relationships between various system's components and are effectively used in business analysis and information systems analysis. They are useful for system’s high-level details modeling, to show how the input data are transformed to output results via the sequence of functional transformations. For description of DFD diagrams are uses two notations — Yourdon and Gane-Sarson, which differ in syntax. Online Store DFD example illustrates the Data Flow Diagram for online store, the interactions between Customers, Visitors, Sellers, depicts User databases and the flows of Website Information. ConceptDraw DIAGRAM enhanced with Data Flow Diagrams solution lets you to draw clear and simple example of DFD for Online Store using special libraries of predesigned DFD symbols.
Business Productivity - Marketing
Mind Map is effective tool for depiction the main idea and related concepts, and representation a thought process. Mind Maps have essential value in marketing field, advertising and sales. They help successfully accomplish marketing goals and easy get marketing answers, to achieve a sustainable competitive advantages and increasing sales. Mind Maps help in new product development, they allow to generate and structure ideas about its properties and features, to define the target customers, brainstorm the key words and phrases for advertising and sales materials. ConceptDraw MINDMAP is a perfect marketing diagramming and marketing strategy tool that help accomplish marketing goals, represent marketing information and easy design Marketing Mind Maps and Marketing Diagrams (Marketing Step Chart, Marketing Mix Diagram, Market Environment Analysis Charts, Sales Pyramids, Target and Marketing Scope Diagrams, Feature Comparison Chart, Product Position Map, Products Comparison Chart, Timeline, SWOT, Boston Growth Matrix, Ansoff Product-Market Growth Matrix) for further using in visual documents and presentations.Improving Problem Solving and Focus with Fishbone Diagrams
When you need to focus on the problem, professional diagramming tool helps you create a Fishbone diagram also known as Ishikawa diagram. Understanding of the problem via Fishbone diagram will improve the processes between departments and teams. ConceptDraw DIAGRAM extended with Fishbone Diagrams solution gives a powerful tool for improving problem solving and focus with Fishbone diagrams.- Bubble diagrams with ConceptDraw DIAGRAM | Bubble diagrams in ...
- Bubble Chart Maker | Bubble Charts | Bubble Chart | Brainstorm ...
- Organization Chart Templates | How To Create an Affinity Diagram ...
- Bubble Diagrams | Idea Outline | Fishbone Diagram Problem ...
- How to Make a Project Tasks Mind Map from Brainstorm | Brainstorm ...
- Brainstorming Diagram
- Circle-Spoke Diagrams | Bubble Diagrams | Image Social ...
- Picture Of Bubble Diagram
- How To Create a Bubble Chart | Business People Figures | Design ...
- Beautiful Pictures To Draw On Chart
- Blank Calendar | Bubble Chart | Lean Manufacturing Diagrams | Plot ...
- Pictures of Graphs | Restaurant Floor Plans | Food Pictures | Draw ...
- Bubble Diagrams | Picture Graphs | Target and Circular Diagrams ...
- Bubble Chart Of Health Centre
- Examples Of Bubble Charts
- Divided Bar Diagrams | Target and Circular Diagrams | Picture ...
- Bubble Chart In Archi
- Bubble Diagrams | Chore charts with ConceptDraw PRO | Sport ...
- Charts On Beauties Of Nature
- Bubble Diagrams | Circle-Spoke Diagrams | Education Package ...

