Organization Chart Templates
Organization Chart Templates - Organizational Charts Solution from the Management Area of ConceptDraw Solution Park provides a wide collection of predesigned templates and samples that will help you create the Organizational Charts of any complexity in one moment.HelpDesk
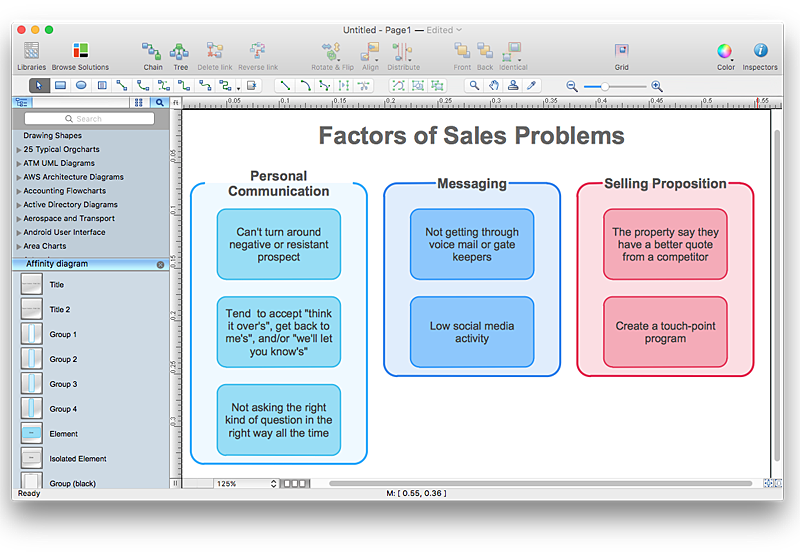
How To Create an Affinity Diagram Using ConceptDraw Office
Affinity diagram is designed to prepare the data for further analysis of the cause-effect relationships.The Affinity diagram shows the structure of large, complex factors that have an influence on a problem, and then divides them up into a smaller and simpler structure. We recommend using a mind map for Brainstorming and collecting the factors affecting the problem. The ability to create an Affinity diagram from a mind map is supported by the ConceptDraw Seven Management and Planning Tools solution.Donut Chart Templates
These donut chart templates was designed using ConceptDraw PRO diagramming and vector drawing software extended with Pie Charts solution from Graphs and Charts area of ConceptDraw Solution Park. All these donut chart templates are included in the Pie Charts solution. You can quickly rework these examples into your own charts by simply changing displayed data, title and legend texts.Line Chart Template for Word
This sample was created in ConceptDraw PRO diagramming and vector drawing software using the Line Graphs Solution from Graphs and Charts area of ConceptDraw Solution Park. This sample shows the Line Chart of annual percentage change. The Line Chart allows you to clearly see the changes of data over the time.Technical Flow Chart Example
What illustrates a technical flow chart? Technical flow chart is a diagrammatic representation which visually illustrates the sequence of operations that must to be performed to get the problem's solution. ConceptDraw PRO enhanced with Flowcharts Solution from the "What is a Diagram" Area of ConceptDraw Solution is a perfect software for drawing Technical Flow Chart Example illustrating the essence and importance of the technical flow chart use.Best Mind Mapping Program for Making Presentations
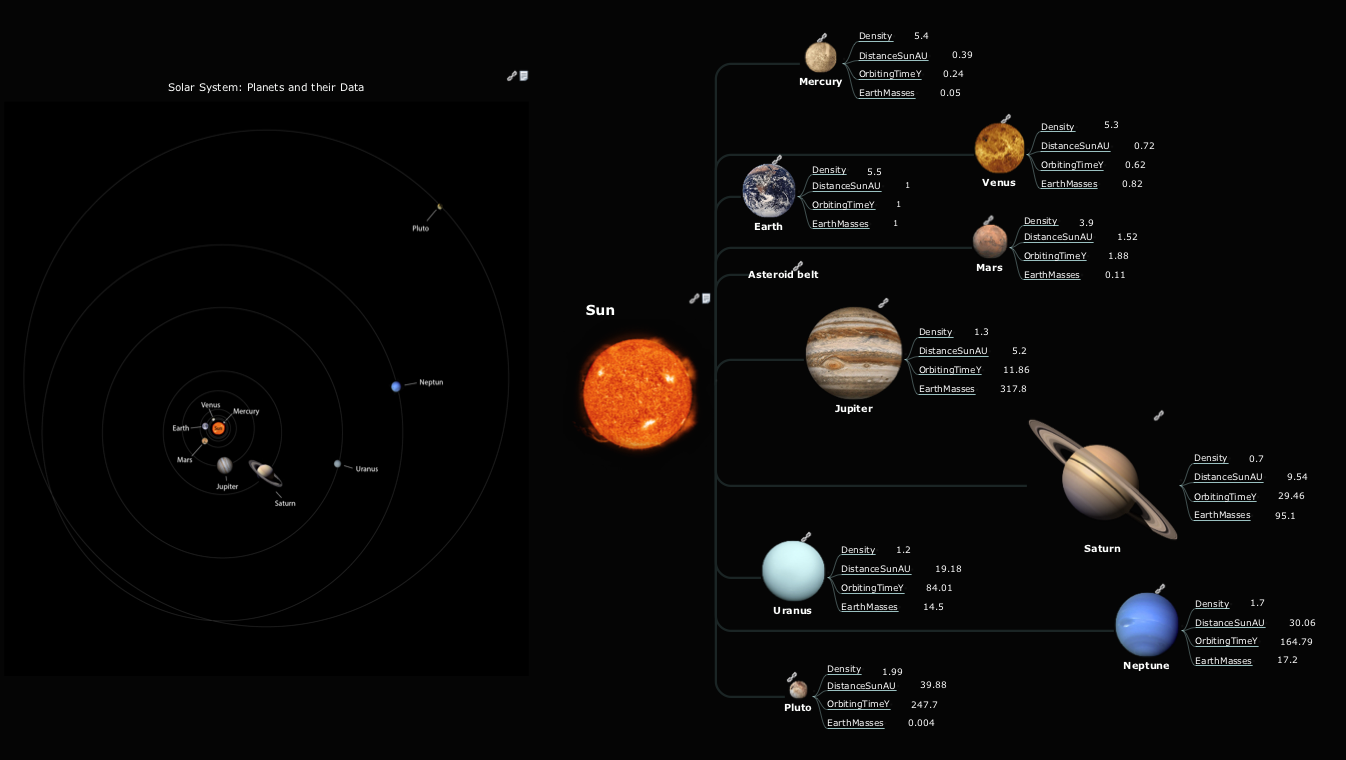
ConceptDraw MINDMAP with the ability to import presentations from Microsoft PowerPoint, as well as enhancing its existing presentation capabilities.Fishbone Diagram Problem Solving
The Ishikawa diagram, Cause and Effect diagram, Fishbone diagram — all they are the names of one and the same visual method for working with causal connections. Originally invented by Kaoru Ishikawa to control the process quality, the Ishikawa diagram is well proven in other fields of management and personal scheduling, events planning, time management. It is a chart in the form of a fish, whose head is a problem, the fins are variants for its causes. To design easily the Fishbone diagram, you can use a special ConceptDraw PRO vector graphic and diagramming software which contains the powerful tools for Fishbone diagram problem solving offered by Fishbone Diagrams solution for the Management area of ConceptDraw Solution Park.Bar Chart Template for Word
All these bar chart templates are included in the Bar Graphs solution. You can quickly rework these bar graph templates into your own charts by simply changing displayed data, title and legend texts.Chart Templates
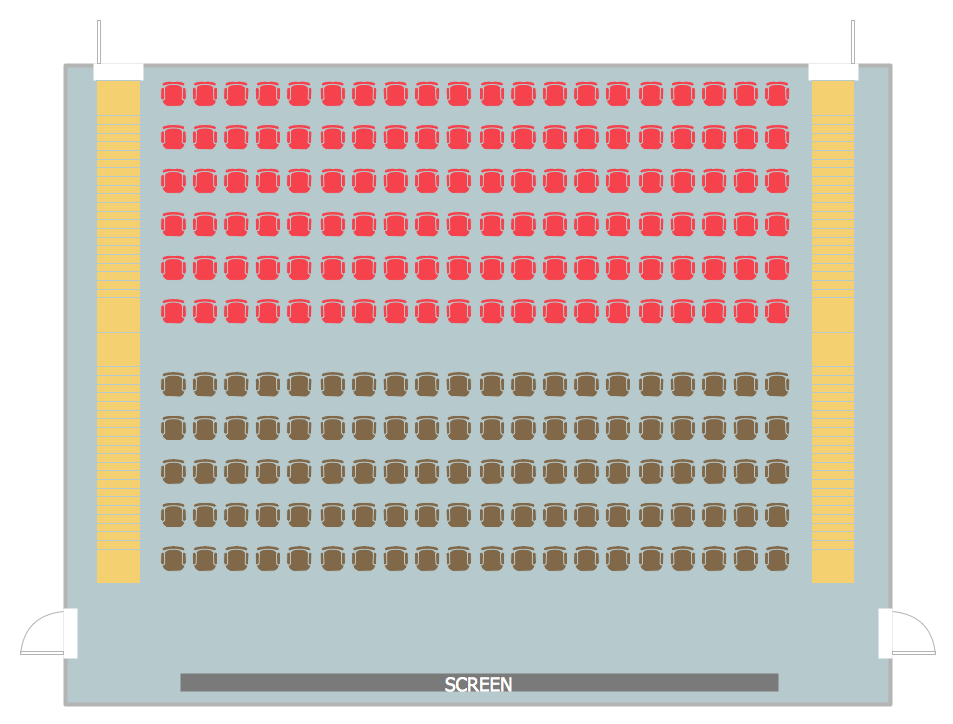
Easy charting software comes with beautiful chart templates and examples. This makes it easy to create professional charts without prior experience.Seating Chart Template
Seating chart developing is necessity for constructing and building the cinemas, theaters, banquet halls, auditoriums, and other premises for accommodation a large number of people. Seating chart template can help you design professional looking seating plan. ConceptDraw PRO diagramming and vector drawing software recommends you to use the Seating Plans solution from the Building Plans area for designing the seating charts.
 Marketing
This solution extends ConceptDraw PRO v9 and ConceptDraw MINDMAP v7 with Marketing Diagrams and Mind Maps (brainstorming, preparing and holding meetings and presentations, sales calls).
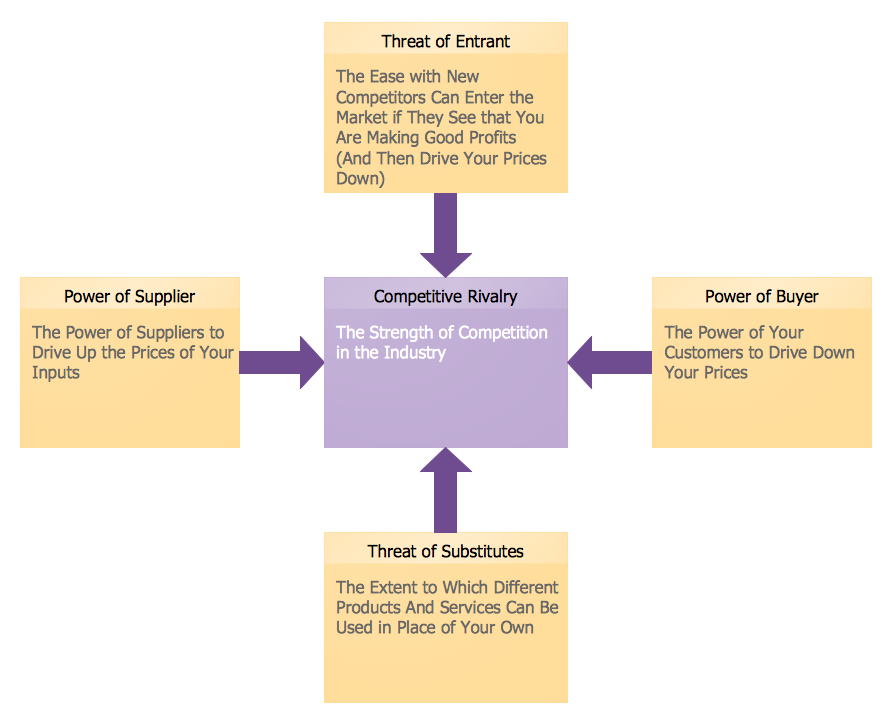
Marketing Charts
ConceptDraw PRO diagramming and vector drawing software offers the Marketing Diagrams Solution from the Marketing Area with extensive drawing tools, predesigned vector shapes, templates and samples for fast and easy drawing marketing charts and diagrams, marketing schemes and flow charts, various marketing illustrations, etc.Column Chart Template
Column chart templates from ConceptDraw collection can help you find the best visual depiction for you data. You can easily modify column chart templates according to data you want to visualize.Software Diagram Templates
Use Software Diagram Templates from the solutions of Software Development area for ConceptDraw PRO to create your own professional looking Software Diagrams in minutes. The Software Diagrams designed with ConceptDraw PRO are vector graphic documents and are available for reviewing, modifying, converting to a variety of formats (image, HTML, PDF file, MS PowerPoint Presentation, Adobe Flash or MS Visio XML), printing and send via e-mail in one moment.Six Markets Model Chart Template
This template shows the Six Markets Model Chart and was included in Marketing Diagrams Solution. It is available from ConceptDraw STORE and can be used as the base for creating your own marketing diagrams.- Marketing | Competitor Analysis | Circle Spoke Diagram Template ...
- Brainstorming Diagram Template
- Spoke Diagram Brainstorming
- Brainstorming Bubbles Template
- How to Make a Project Tasks Mind Map from Brainstorm | How to ...
- Brainstorming Diagram
- Brainstorming Meeting Agenda Template
- Brainstorming Bubble
- How to Make a Project Tasks Mind Map from Brainstorm | Brainstorm ...
- Brainstorming Map Template
- Brainstorming Bubble Chart Images
- How to Brainstorm with ConceptDraw MINDMAP | Brainstorming ...
- Map Ae Templates
- ConceptDraw MINDMAP: Brainstorming , Mind Mapping for macOS ...
- Process Flowchart | ConceptDraw MINDMAP: Brainstorming , Mind ...
- Free Bubble Diagram Template
- Bubble Charts | How To Create a Bubble Chart | Bubble Chart ...
- Human Resource Development | HR Flowcharts | Gant Chart in ...
- Bubbles Brainstorming

