ConceptDraw MINDMAP : Brainstorming, Mind Mapping for macOS and Windows
ConceptDraw MINDMAP is a powerful business and personal productivity software application that provides visual organization and access to information for individuals and organizations.Product Overview
The role of ConceptDraw MINDMAP is to organize and plan idea development and communicate between process participants. Mind maps are convenient to prepare presentations for team and management and send task lists and related information.Brainstorm Exchanging Mind Maps with Evernote
You will be able to use a Note Exchange solution to share mindmaps and mindmap data across your entire organization. It has never been easier to run brainstorm ideas for building strategies.Basic Flowchart Symbols and Meaning
Flowcharts are the best for visually representation the business processes and the flow of a custom-order process through various departments within an organization. ConceptDraw DIAGRAM diagramming and vector drawing software extended with Flowcharts solution offers the full set of predesigned basic flowchart symbols which are gathered at two libraries: Flowchart and Flowcharts Rapid Draw. Among them are: process, terminator, decision, data, document, display, manual loop, and many other specific symbols. The meaning for each symbol offered by ConceptDraw gives the presentation about their proposed use in professional Flowcharts for business and technical processes, software algorithms, well-developed structures of web sites, Workflow diagrams, Process flow diagram and correlation in developing on-line instructional projects or business process system. Use of ready flow chart symbols in diagrams is incredibly useful - you need simply drag desired from the libraries to your document and arrange them in required order. There are a few serious alternatives to Visio for Mac, one of them is ConceptDraw DIAGRAM. It is one of the main contender with the most similar features and capabilities.
Flowchart Definition
Flowchart definition - A Flowchart is a diagram that graphically represents the structure of the system, the flow of steps in a process, algorithm, or the sequence of steps and decisions for execution a process or solution a problem. For depiction the steps there are used specific shapes and graphic symbols which are linked by lines and directional arrows. The main standard shapes are rectangle or box, rounded box, diamond, circle. A Flowchart is a convenient way to observe the follow the process from beginning to end, it lets improve the work of process, highlight the key elements and detach not essential or even excessive steps. The Flowcharts can represent different levels of detail: High-Level Flowchart, Detailed Flowchart, and Deployment or Matrix Flowchart. They are incredibly useful for programmers when developing the programs of any complexity and on any high level language. Create your own Flowcharts using the ConceptDraw DIAGRAM diagramming and vector drawing software and powerful tools of Flowcharts solution from "Diagrams" area.
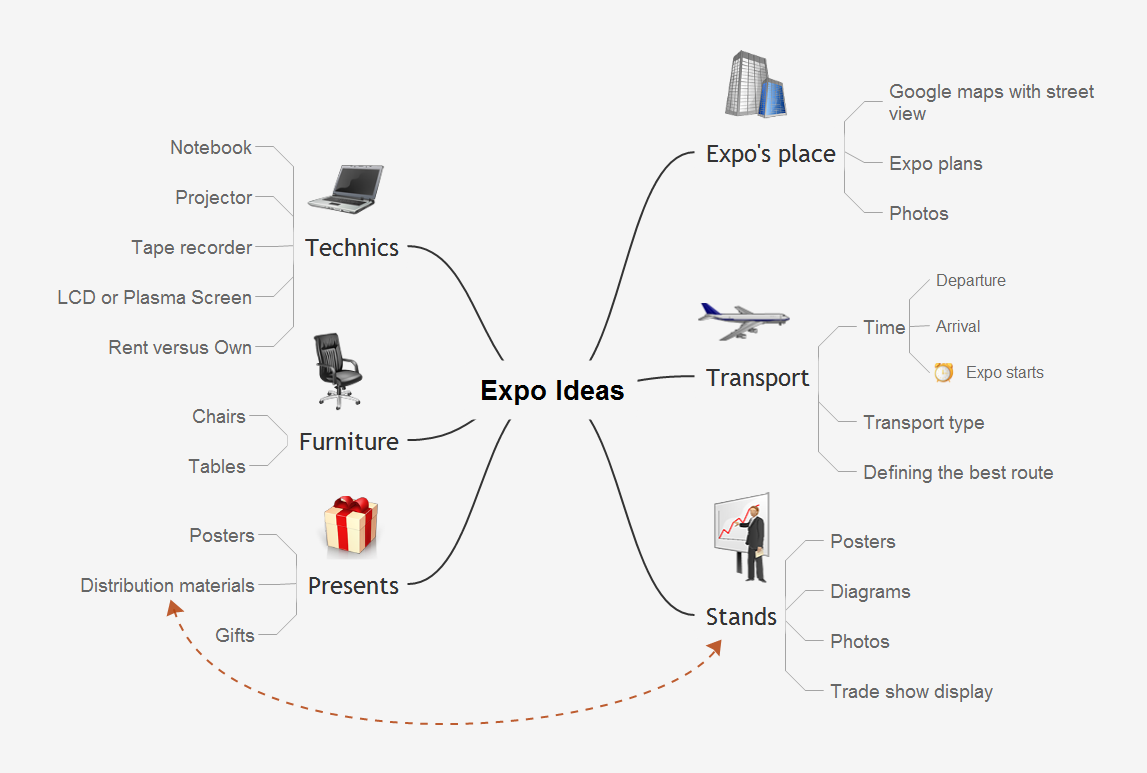
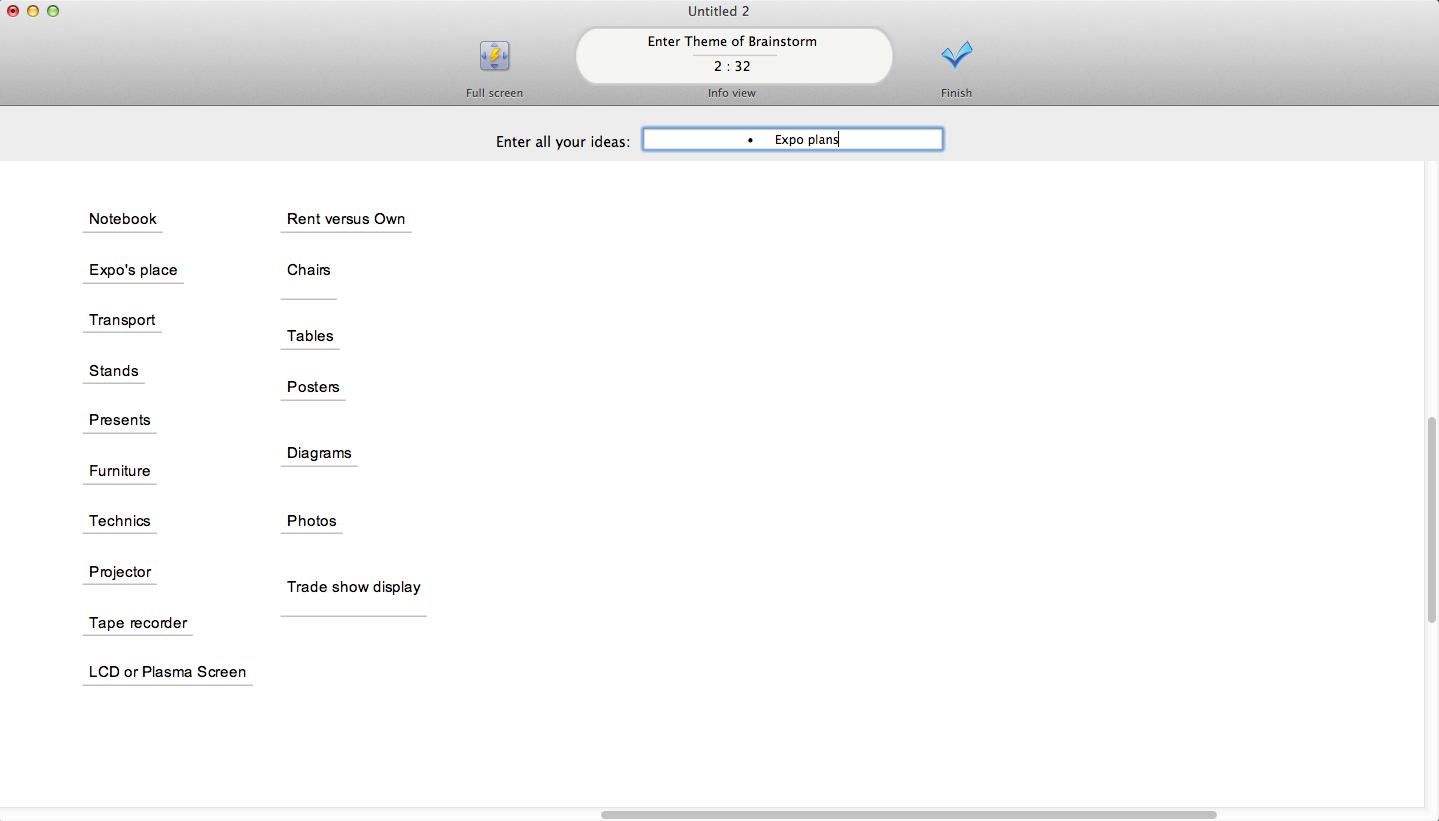
Brainstorming in ConceptDraw MINDMAP
Video tutorials on ConceptDraw products. Try it today!HelpDesk
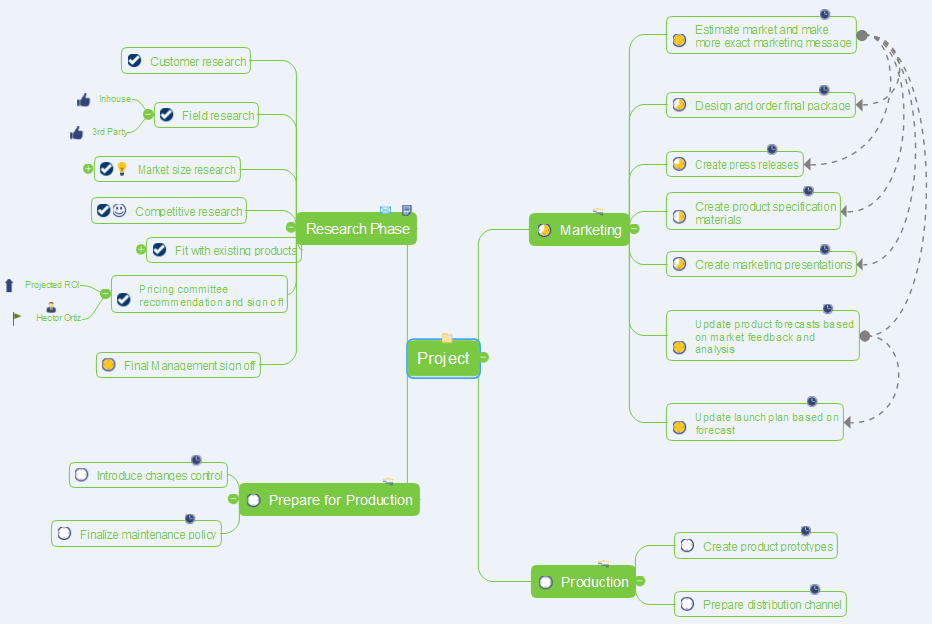
How to Make a Project Tasks Mind Map from Brainstorm
Start a project with creating a mind map, structuring ideas captured during a brainstorming session. The easiest way to start a new project is to conduct a brainstorming session that identifies the necessary tasks and then to develop it into a project schedule.Brainstorming Software
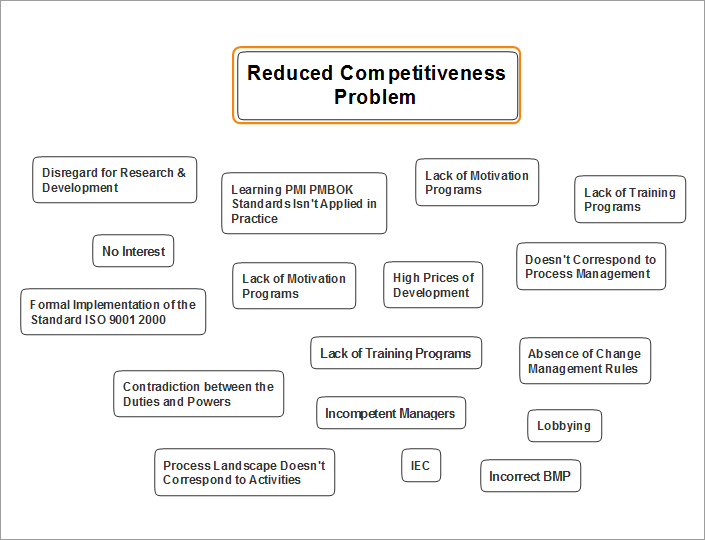
Brainstorming is an effective and widely used tool for generating large quantity of ideas by group of people in a short time. ConceptDraw MINDMAP is a powerful brainstorming software! ConceptDraw MINDMAP lets you easy and effectively generate and organize ideas and data, and also create the illustrative mind maps.Affinity Diagram
The Affinity Diagram, also known as a KJ diagram, is a business tool invented for organization the large quantity of ideas and data. It is a part of Seven Management and Planning Tools, it is usually used right after brainstorming to sort large numbers of ideas into the corresponding groups. The Affinity Diagram helps to represent in a better way the structure of large and complex factors which influence on a problem, divides these factors into the smaller and simpler structures, and helps team members to see the patterns and identify possible solutions to problems they have. The diagrams of this type don't show the causal relationships between the factors, but they are designed to prepare the data for holding further analysis of the cause-effect relationships. Another area of Affinity Diagram usage is contextual inquiry as a way to sort observations and notes from field interviews, support call logs, open-ended survey responses organizing, etc. ConceptDraw MINDMAP software offers you the tools for easy holding brainstorming, generation ideas and creation MINDMAP Affinity Diagram.Relations Diagram
The Relations Diagram is used to identify how the factors influence each other, to determine what factors are causes and what are effects. The factors mostly influencing are called “drivers”, the primarily affected factors are “indicators”. The problem solving is focused on the change of "drivers" factors by applying the corrective actions. The "indicators" factors help establish the Key Performance Indicators (KPIs) to monitor the changes and also define the effectiveness of the corrective actions in resolving a problem. ConceptDraw MINDMAP software ideally suits for designing Relations Diagrams. The easiest way to create the MINDMAP Relations Diagram, is to use the included Relations Diagram input template. Open it in ConceptDraw MINDMAP application from the Input tab and hold a new brainstorming session, identify the central issue and the contributing factors to this issue. Click the Finish Brainstorm button to generate a Mind Map and begin the further work with it, or select Relations Diagram item from the Output tab to automatically draw it in ConceptDraw DIAGRAM application.- Process Flowchart | ConceptDraw MINDMAP: Brainstorming , Mind ...
- Brainstorming Flowchart Of Weather Update
- ConceptDraw Arrows10 Technology | Data Flow Diagram Process ...
- Product Overview | How to Brainstorm with ConceptDraw MINDMAP ...
- ConceptDraw MINDMAP: Brainstorming , Mind Mapping for macOS ...
- Process Flowchart | Basic Flowchart Symbols and Meaning ...
- Flowchart Components | ConceptDraw MINDMAP: Brainstorming ...
- HR Flowcharts | ConceptDraw MINDMAP: Brainstorming , Mind ...
- Brainstorming List Example