Competitor Analysis
Competitor analysis is a first and obligatory step in elaboration the proper corporate marketing strategy and creating sustainable competitive advantage. Use powerful opportunities of numerous solutions from ConceptDraw Solution Park for designing illustrative diagrams, charts, matrices which are necessary for effective competitor analysis."Brand essence is a phrase that communicates the fundamental nature of a trade name associated with one or more products made by the same company. A business marketing team will often spend considerable time developing effective ways of expressing the brand essence of their company's various brands by highlighting the unique benefits provided that pertain to the values of its target subculture." [businessdictionary.com/ definition/ brand-essence.html]
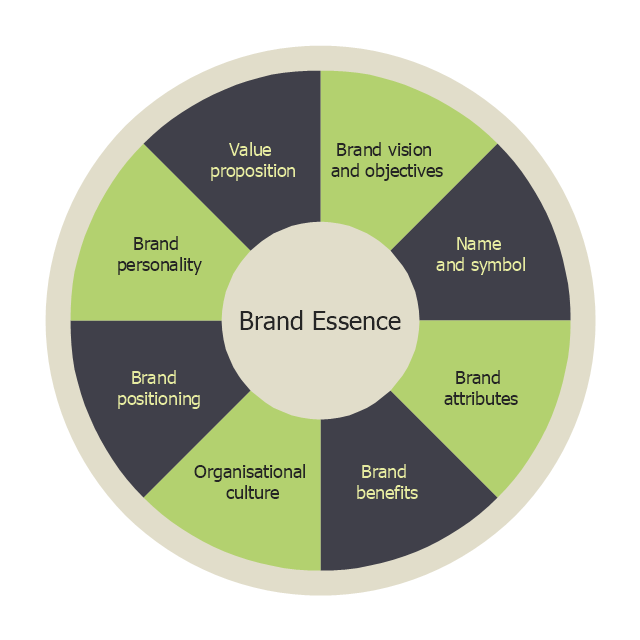
Brand essence model diagram visually display key points of brand essence in easy to understand form.
The example of wheel diagram (ring diagram, bevel style circle diagram) "Brand essence model" was created using the ConceptDraw PRO diagramming and vector drawing software extended with the Target and Circular Diagrams solution from the Marketing area of ConceptDraw Solution Park.
www.conceptdraw.com/ solution-park/ marketing-target-and-circular-diagrams
 Scrum Workflow
The Scrum Workflow Solution extends the capabilities of ConceptDraw DIAGRAM with a large collection of professionally-designed samples and a selection of ready-to-use scrum design elements: scrum diagrams and arrows, scrum icons of people, artifacts, workflow, workspace and other colorful scrum clipart, and also scrum charts.
 Target and Circular Diagrams
This solution extends ConceptDraw DIAGRAM software with samples, templates and library of design elements for drawing the Target and Circular Diagrams.
 Fishbone Diagrams
The Fishbone Diagrams solution extends ConceptDraw DIAGRAM software with the ability to easily draw the Fishbone Diagrams (Ishikawa Diagrams) to clearly see the cause and effect analysis and also problem solving. The vector graphic diagrams produced using this solution can be used in whitepapers, presentations, datasheets, posters, and published technical material.
Software Diagrams
Modern software development begins with designing different software diagrams and also uses a large amount of diagrams in project management and creation graphic documentation. Very popular diagrams that depict a work of applications in various cuts and notations, describe databases and prototype Graphical User Interfaces (GUIs). Software engineering specialists and software designers prefer to use special technical and business graphics tools and applications for easy creation diagrams. One of the most popular is ConceptDraw DIAGRAM diagramming and vector drawing software. ConceptDraw DIAGRAM offers the possibility of drawing with use of wide range of pre-drawn shapes and smart connectors, which allow to focus not on the process of drawing, but on the task's essence. It is a perfect application for design and document development, planning tasks, visualization of data, design the databases, object-oriented design, creation flowcharts of algorithms, modeling business processes, project management, automation of management and development processes, and for many other tasks.
 Food Court
Use the Food Court solution to create food art. Pictures of food can be designed using libraries of food images, fruit art and pictures of vegetables.
 Circle-Spoke Diagrams
Examples of subject areas that are well suited to this approach are marketing, business, products promotion, process modeling, market, resource, time, and cost analysis. Circle-Spoke Diagrams are successfully used in presentations, conferences, management documents, magazines, reportages, reviews, reports, TV, and social media.
Target Diagram
Target Diagram is a convenient and visual way of presentation information which is popular and widely used in marketing, business and economics. ConceptDraw DIAGRAM diagramming and vector drawing software extended with Target and Circular Diagrams solution from the Marketing area of ConceptDraw Solution Park is ideal for fast and easy drawing a Target Diagram.
 Sales Flowcharts
The Sales Flowcharts solution lets you create and display sales process maps, sales process workflows, sales steps, the sales process, and anything else involving sales process management.
 Circular Arrows Diagrams
Circular Arrows Diagrams solution extends ConceptDraw DIAGRAM with extensive drawing tools, predesigned samples, Circular flow diagram template for quick start, and a library of ready circular arrow vector stencils for drawing Circular Arrow Diagrams, Segmented Cycle Diagrams, and Circular Flow Diagrams. The elements in this solution help managers, analysts, business advisers, marketing experts, scientists, lecturers, and other knowledge workers in their daily work.
- Brand essence model - Wheel diagram | Competitor Analysis ...
- Brand essence model - Wheel diagram | Marketing mix - Wheel ...
- Pie chart - Template | Design elements - Composition charts and ...
- Marketing mix - Wheel diagram
- Pie Chart Examples and Templates | Donut Chart Templates ...
- Gym and Spa Area Plans | How to Draw a Pie Chart Using ...
- Pie Chart Examples and Templates | Atmosphere air composition ...
- National Preparedness Cycle - Arrow ring chart | Program to Make ...
- Block diagram - Branding strategies | Pyramid Chart Examples ...
- Diagram Matketing
- Exploded pie chart - European Parliament election | Europe browser ...
- Daily Schedule Chart | Marketing | Target Diagram | Marketing Mix ...
- Marketing mix - Wheel diagram | Target diagrams - Vector stencils ...
- BPR Diagram . Business Process Reengineering Example | Circular ...
- Example Of A Matrix Chart
- Vector Cycle Arrow Diagram
- Functional Block Diagram | Block Diagrams | Functional Flow Block ...
- How to Draw an Organization Chart | Organizational Structure ...
- Circular Arrow Chart
- Business Process Modeling Software for Mac | BPM Software | BPM ...


