This site uses cookies. By continuing to browse the ConceptDraw site you are agreeing to our Use of Site Cookies.

Competitor Analysis

Competitor analysis is a first and obligatory step in elaboration the proper corporate marketing strategy and creating sustainable competitive advantage. Use powerful opportunities of numerous solutions from ConceptDraw Solution Park for designing illustrative diagrams, charts, matrices which are necessary for effective competitor analysis.

human resources, human resource management, recruitment, hiring process, human resource development HR Flowcharts

human resources, human resource management, recruitment, hiring process, human resource development
Human resource management diagrams show recruitment models, the hiring process and human resource development of human resources.

Flowchart Process Example

ConceptDraw DIAGRAM is a professional software for creating great looking flowcharts. The samples included in this set of software allows users to draw any type of flowchart.

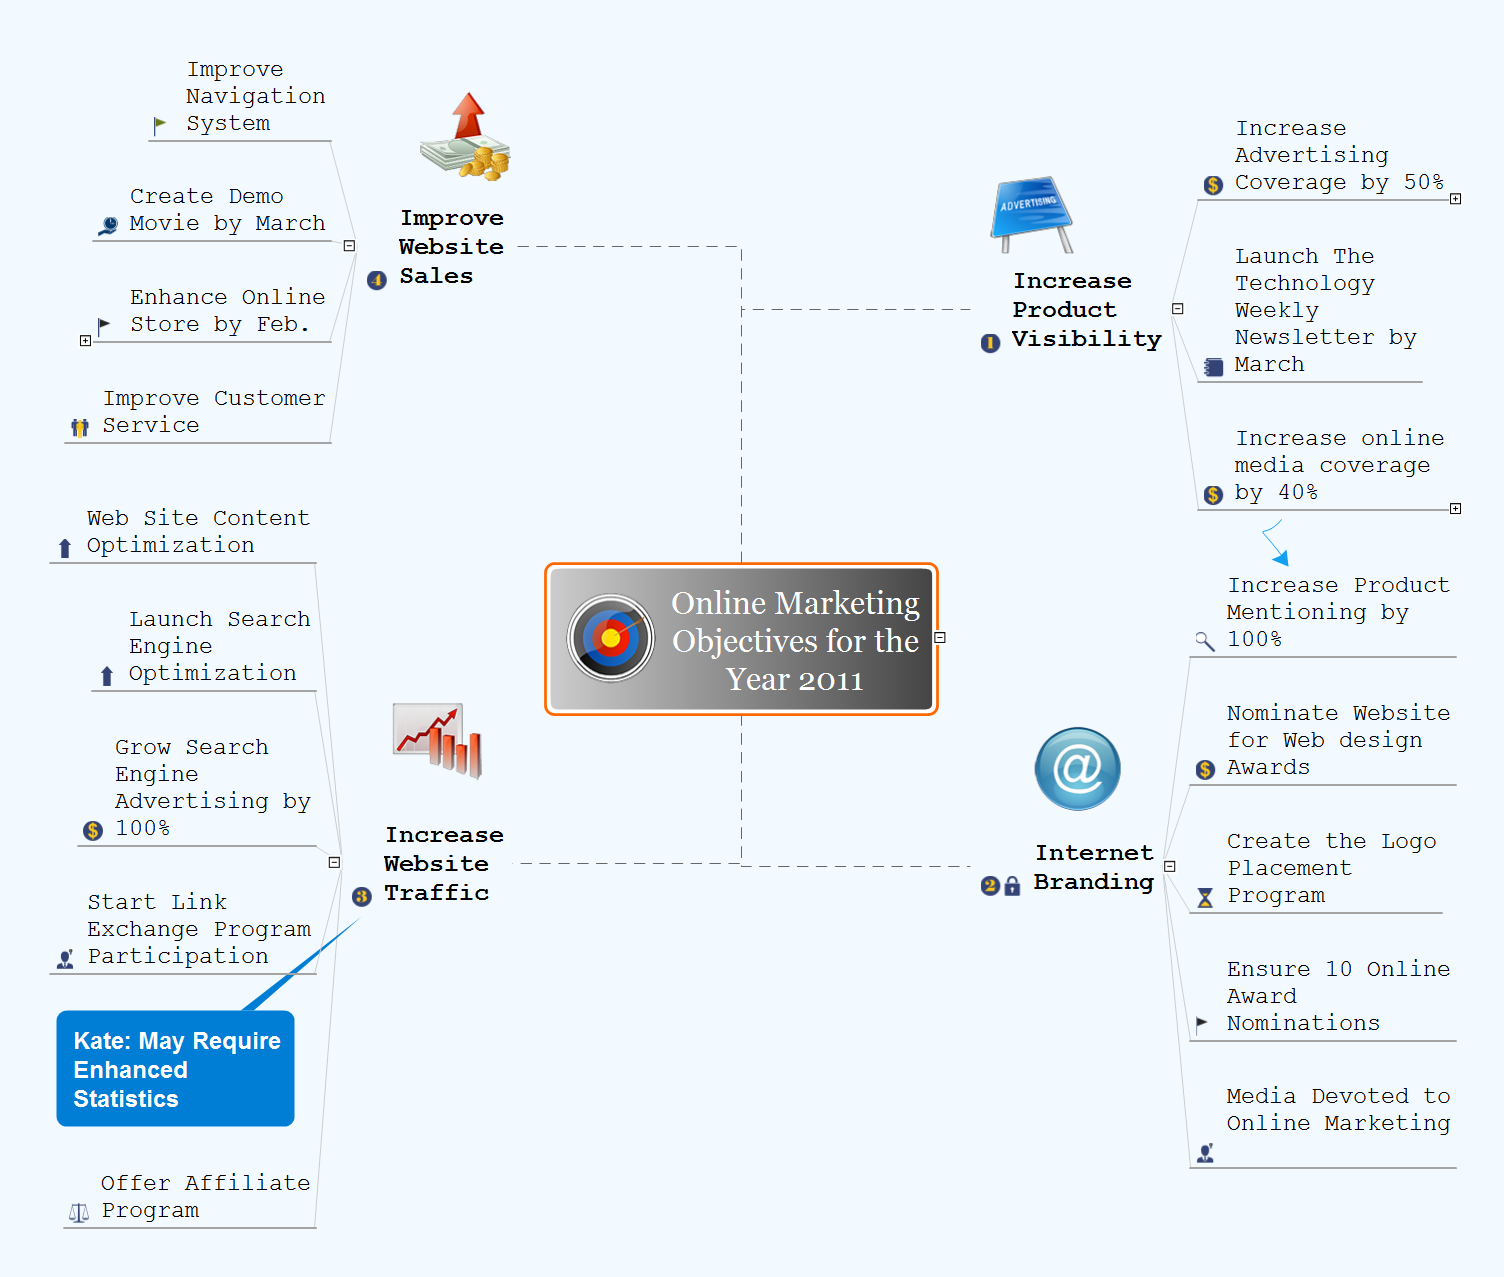
Online Marketing Objectives

Promotion and sale of goods or services, as well as the conquest of free niche on the market in a given category include numerous methods directed on the advertising the products and attraction attention of potential buyers. Among them are traditional methods of struggle for the buyer, as well as internet marketing or online marketing, that is a complex of measures aimed at attraction of clients using the online technologies. The main tool of online marketing is a website of the company. The proper preparation and promotion of website ensure to the owner the opportunity to successfully compete with manufacturers of similar products, ensuring the high sales. Today each manufacturer, regardless of the size and direction of activities, creates a website, online store, blog, pages in social networks that give the visitors full information about the company, its products and services. Given the fact that a potential buyer spends a lot of time at the Internet, such strategy is justified and the practice shows a high efficiency of online marketing. ConceptDraw MINDMAP helps to illustrate a value of outline marketing on a Mind Map, to represent the online marketing objectives for a company and to specify the targets outlined for each of these objectives.

fishbone diagram, Ishikawa diagram, cause and effect analysis Fishbone Diagrams

fishbone diagram, Ishikawa diagram, cause and effect analysis
The Fishbone Diagrams solution extends ConceptDraw DIAGRAM software with the ability to easily draw the Fishbone Diagrams (Ishikawa Diagrams) to clearly see the cause and effect analysis and also problem solving. The vector graphic diagrams produced using this solution can be used in whitepapers, presentations, datasheets, posters, and published technical material.

Functional Flow Block Diagram

You need to draw a Functional Flow Block Diagram? You are an artist? Now it doesn't matter. With Block Diagrams solution from the "Diagrams" area for ConceptDraw Solution Park you don't need more to be an artist to design the Functional Flow Block Diagram of any complexity.

How to Create a Social Media DFD Flowchart

The use of social media in modern conditions helps the companies to be more effective in timely messaging - actively and rapidly response to a customer posts in social media, to find quickly the appropriate response to social media mentions, to save greatly the budget. Many companies even use the social media as a lead tool for promotion. But how to create a Social Media DFD Flowchart, Social Media Response Flowchart or Action Mind Map fast and easy? ConceptDraw DIAGRAM ector graphical software and Social Media Response solution included to ConceptDraw Solution Park assist greatly in their creation. This solution improves the quality of content in social media and helps to build an active customer community. The samples and examples included to Social Media Response solution are helpful for social media teams in developing a social media strategy, in refining and organizing the response process, in creation training materials by trainers and consultants for education the social media groups on how to accomplish the most effectiveness in their daily work.

Pyramid Diagram

Pyramid diagram is a chart used to visualize the data in a hierarchical (pyramid-like) structure and depict the foundation-based relationships. Pyramid diagram looks like a triangle divided by lines into several sections (layers) and can be oriented up or down, and represented in 2D or 3D view. 2D Pyramid diagrams are a great way to illustrate the hierarchical structure, 3D Pyramids are equally good to represent the class stratification and hierarchy. ConceptDraw DIAGRAM diagramming and vector drawing software with included Pyramid Diagrams solution from Marketing area of ConceptDraw Solution Park is a powerful application which contains templates and library of vector design elements for instantly drawing three level Pyramid model, four level and five level Triangle charts. All predesigned objects are easy for changing color style and resizing according to your needs, and ConceptDraw documents with Pyramid diagrams can be easy exported in various formats for further using in marketing presentations, for effective analyzing hierarchy levels and illustration your data and ideas.

Pyramid Chart Examples

Pyramid Charts and Triangle Diagrams are used to visually structure the topics and progressively order the quantitative data. They allow to illustrate hierarchical structure of the topics, proportional, interconnected and containment relations among the topics. The multilevel Pyramids and Triangle diagrams are constructed oriented up or down and divided into several horizontal slices. They are effectively used to represent marketing strategies, social strategies, information systems, market value, etc., to illustrate presentations, websites, documents, reports in business, finances, sales, management, marketing, media, training, consulting, and many other fields. To maximize the efficiency in drawing the Pyramid Charts, use the ConceptDraw DIAGRAM diagramming and vector drawing software extended with Pyramid Diagrams solution from Marketing area, which contains the set of Pyramid Chart examples, samples, templates and vector design elements of triangular diagrams and pyramids with different quantity of levels for various needs.

Block Diagram

The vector stencils libraries: Block Diagrams, Blocks with Perspective, Callouts, Connectors, Raised Blocks from the solution Block Diagrams contain specific block diagram symbols such as arrows, input/output symbols, start/end symbols, processing symbols, conditional symbols, commenting symbols, callouts, connectors, etc. for ConceptDraw DIAGRAM diagramming and vector drawing software. The Block Diagrams solution is contained in a "Diagrams" area of ConceptDraw Solution Park. Use the libraries from the Block Diagrams solution to draw block diagrams for your business documents, presentations and websites in a few minutes.