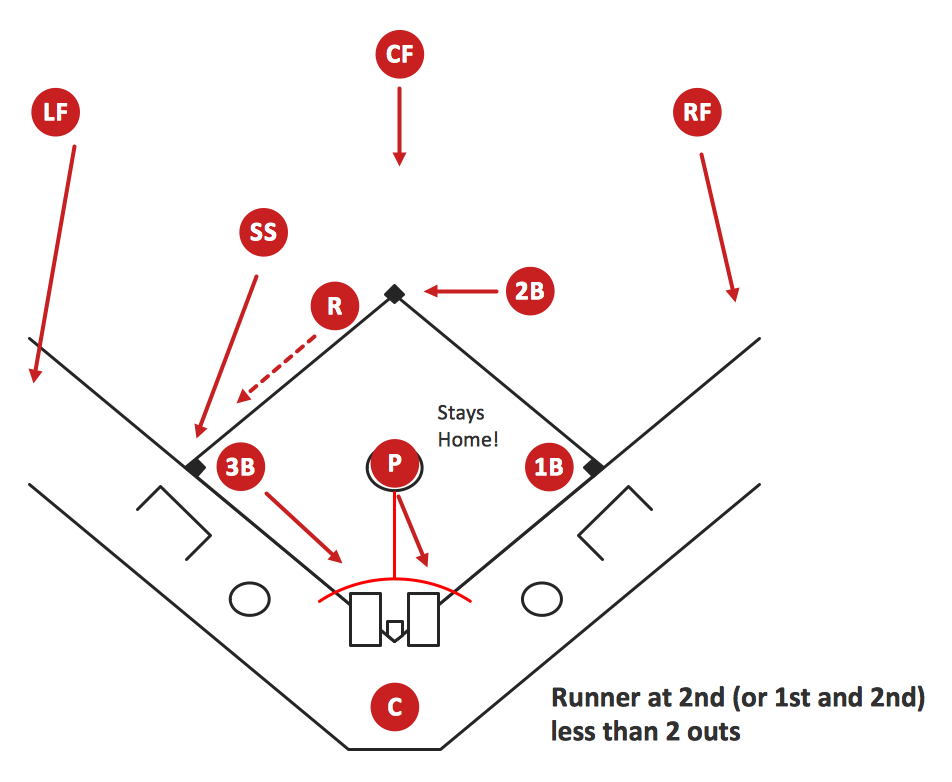
Baseball Diagram – Basic Bunt Coverage – Runner at 2nd
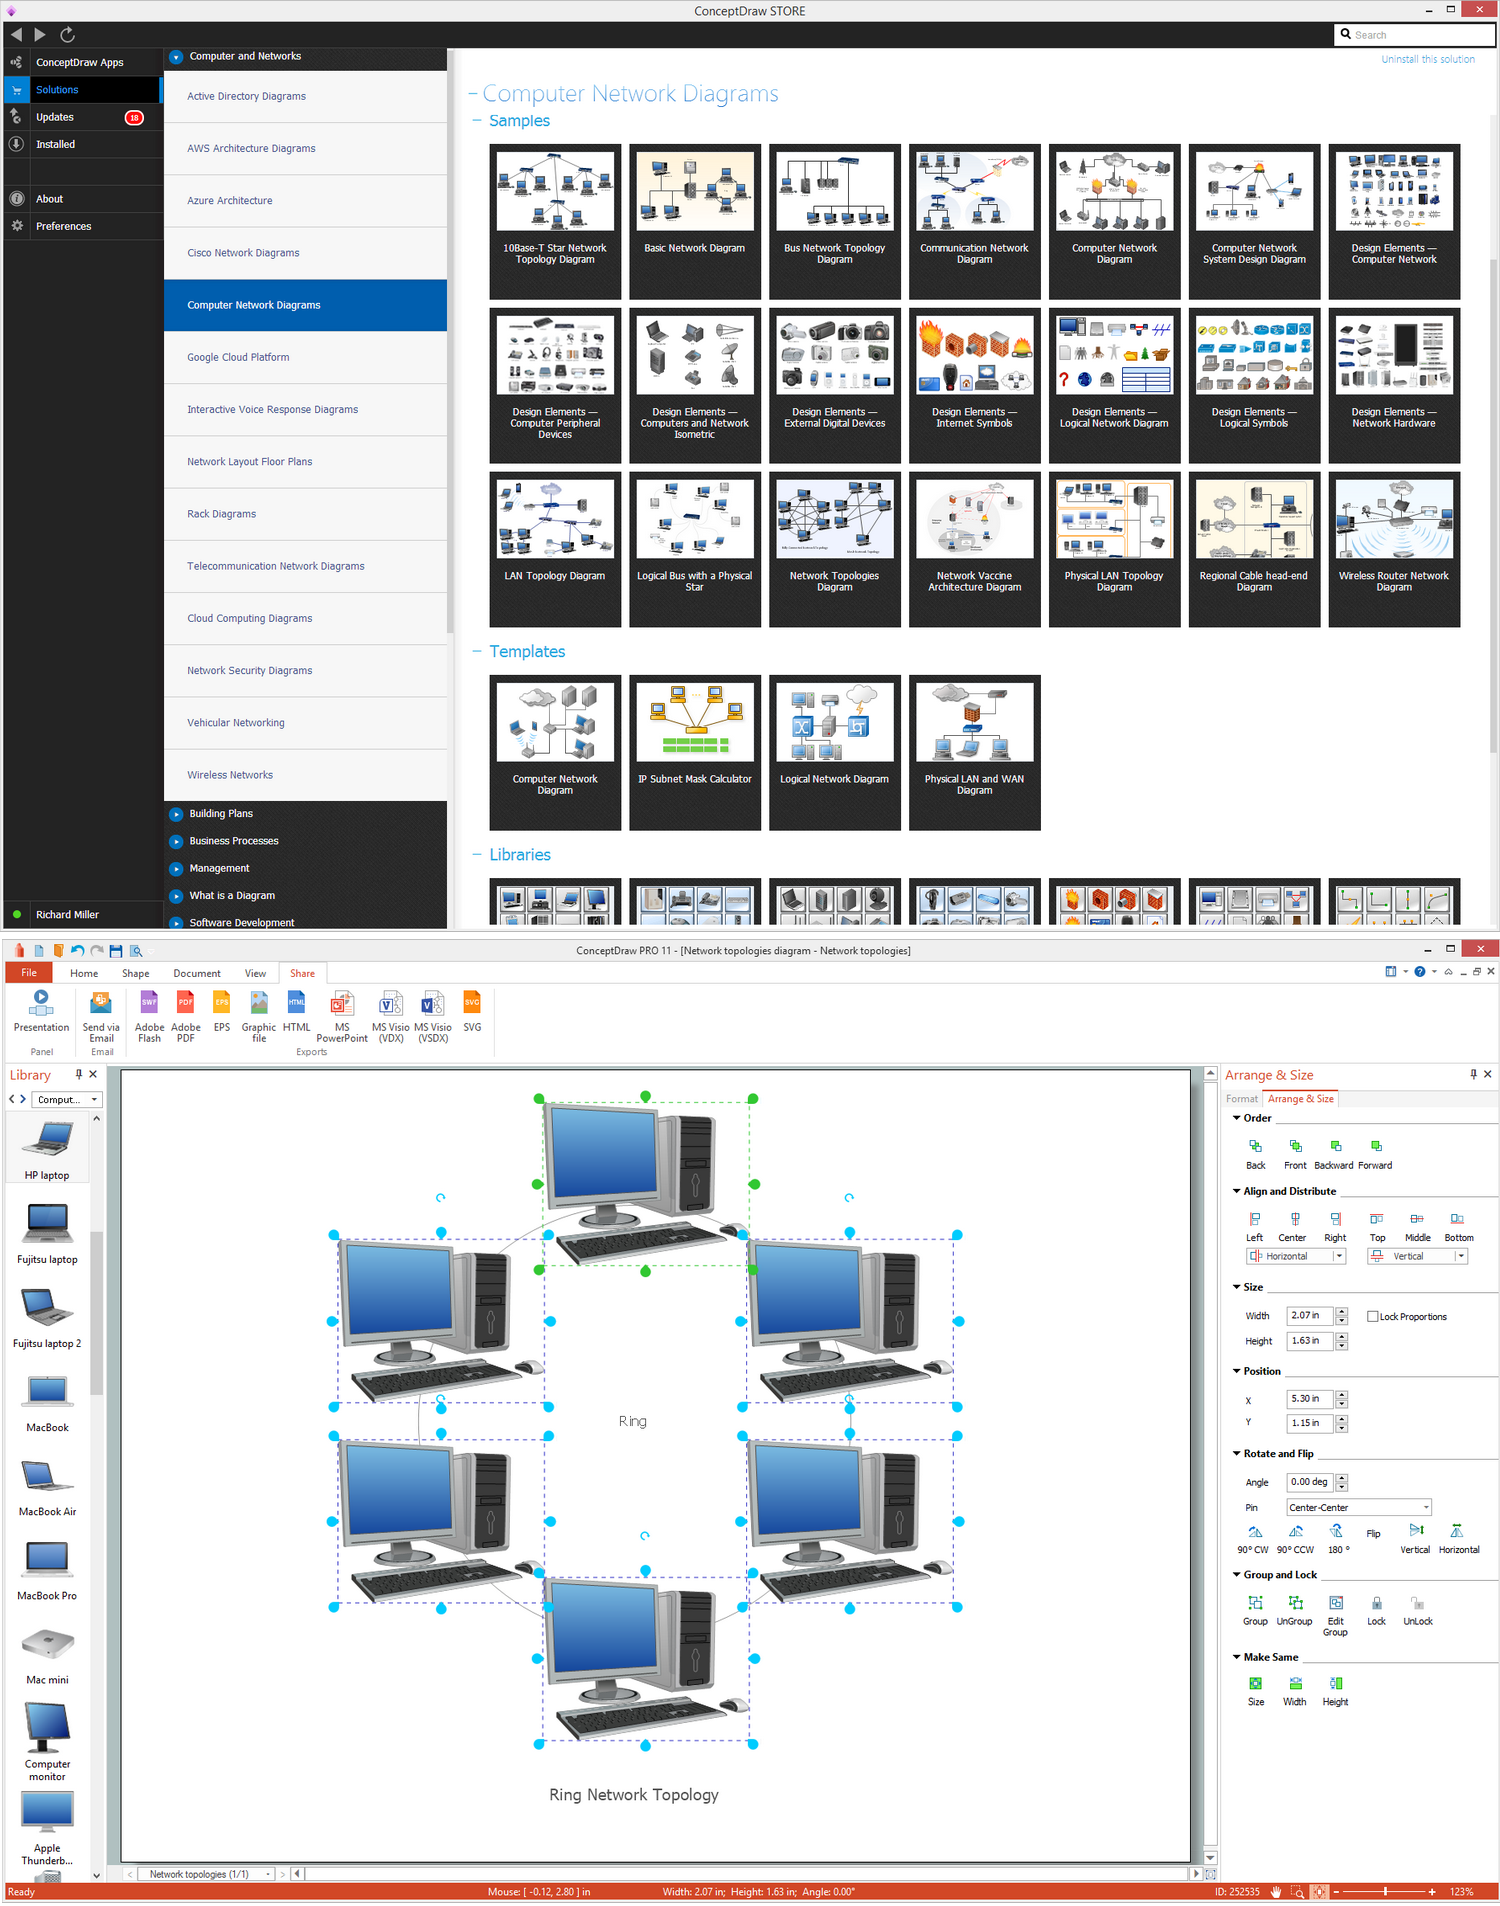
Ring Network Topology
Pyramid Diagram

Best Software for Making Presentations
Garrett IA Diagrams with ConceptDraw DIAGRAM

Entity Relationship Diagram Symbols

 Word Exchange
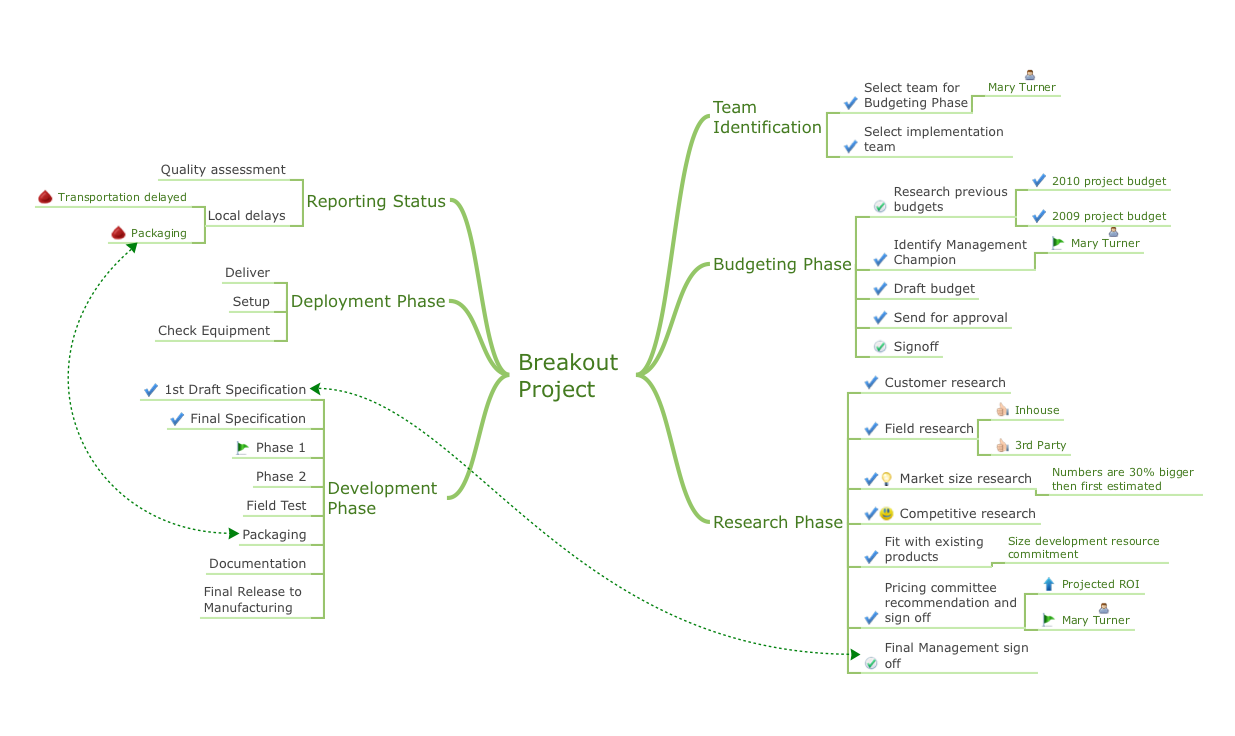
This solution extends ConceptDraw MINDMAP software with the ability to quickly create the framework for a future article or book, fill the structure with ideas, and use it to produce an MS Word document with just a simple click of the mouse.
 IDEF Business Process Diagrams
Use the IDEF Business Process Diagrams solution to create effective database designs and object-oriented designs, following the integration definition methodology.
Fishbone Diagram Example

How to Construct a Fishbone Diagram

- House Breakout Plan In Hotel
- Logical network topology diagram | Network Diagram Software ...
- Wireless router network diagram | Wireless Network Mode | Cisco ...
- Block diagram - Automotive HVAC system | SYSML | Cisco network ...
- Diagram For Bathroom And Stair
- Communication network diagram | Computer network - Vector ...
- Layout Diagram Of Bathroom And Toilet
- How to Create a CCTV Diagram in ConceptDraw PRO | Wireless ...
- Router Firewall Switch Diagram
- Diagrams Of Firewall