HelpDesk
How to Draw a Line Chart Quickly
A common line chart is a graphical representation of the functional relationship between two series of data. A line chart that is created by connecting a series of data points together with a straight line is the most basic type of a line chart. A line chart can be used for depicting data that changes continuously over time. It is extensively utilized in statistics, marketing and financial business. ConceptDraw Line Graph solution provides the possibility to make 2D line charts quickly and effortlessly.
 Business Processes Area
Solutions of Business Processes area extend ConceptDraw PRO software with samples, templates and vector stencils libraries for drawing business process diagrams and flowcharts for business process management.
 Business Process Diagrams
Business Process Diagrams solution extends the ConceptDraw PRO BPM software with RapidDraw interface, templates, samples and numerous libraries based on the BPMN 1.2 and BPMN 2.0 standards, which give you the possibility to visualize equally easy simple and complex processes, to design business models, to quickly develop and document in details any business processes on the stages of project’s planning and implementation.
HelpDesk
How to Connect Objects in ConceptDraw PRO on PC
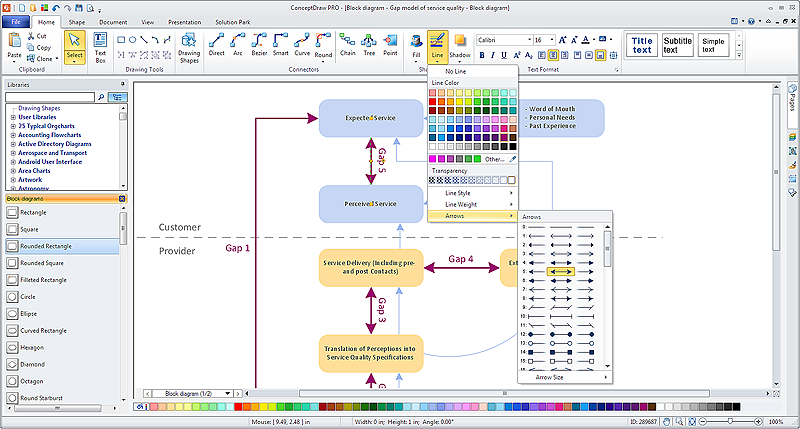
ConceptDraw PRO provides a few options for drawing connections between objects: Direct Connectors, Smart, Arc, Bezier, Curve and Round Connectors. You can connect objects in your ConceptDraw diagram with proper connectors using the embedded automatic connection modes. This article describes how you can connect objects with connectors and how you can ascribe different types and behaviors.
HelpDesk
How to Draw a Histogram in ConceptDraw PRO
Histogram is a diagram used to visualize data through bars of variable heights. Making histogram can be helpful if you need to show data covering various periods (hours, days, weeks, etc). When the vertical column of the histogram refer to frequency it shows how many times any event happens. It is a Frequency histogram. A bar chart diagram is similar to a histogram, but in contrast to a bar chart a histogram represents the number how many times there have been certain data values. You can use a histogram to depict continual data flow such as temperature, time, etc. You can effortlessly draw histograms using the Histograms solution for CnceptDraw PRO. Making a histogram can by very useful to represent various statistical data.- Organizational Chart Broken Line Symbol
- Broken Lines In Organizational Chart
- Meaning Of Broken Line In Organizational Chart
- Flow Chart Broken Line Meaning
- What Does Broken Lines Indicate In Organisation Chart
- Basic Flowchart Symbols and Meaning | How to Draw a Line Chart ...
- What Does Dotted Line Shows In Flow Chart
- Org Chart Generator Dotted Lines
- Broken Lines Are Used On Softeare
- Erd Broken Line Meaning
- How I Represent Dashed Line Notation In Straight Line
- Dotted Line Process Map
- Flowchart Dotted Line Meaning
- Why We Use Dotted Line Ina Flow Chart
- Er Diagram Symbols Dotted Line
- Dotted Line Connectors
- Meaning Of Dotted Line In Er Diagram
- What Does Dotted Line Indicates In Flowchart
- Process Flow Chart Symbols Broken Lines
- Dotted Box In Erd


