HelpDesk
How to Create a Bubble Diagram Using ConceptDraw PRO
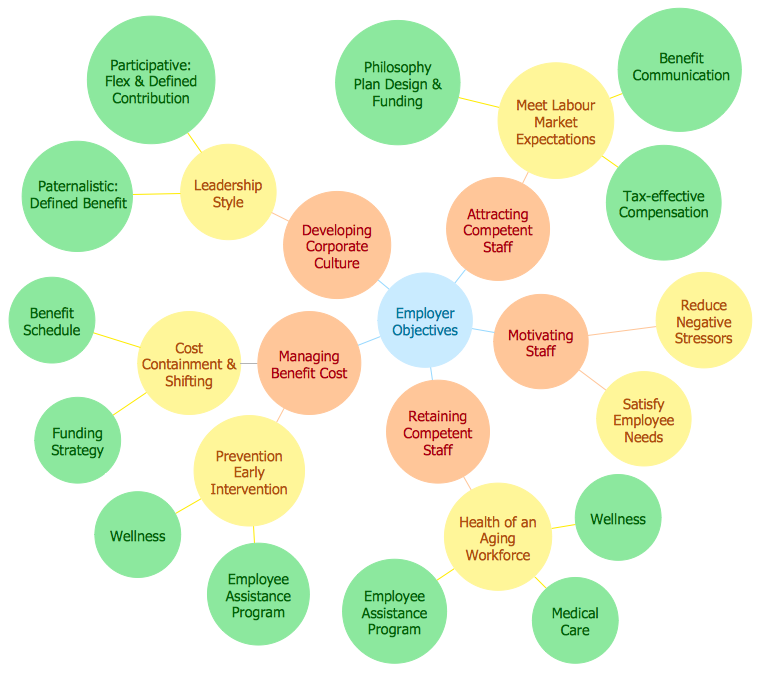
Bubble Diagram is a simple chart that consists of circles (bubbles) repesening certain topics or processes. Bubbles are connected by lines depicting the type of relationships between the bubbles. The size of each bubble is depended on the importance of the entity it represents. Bubble charts are widely used throughout social, economical, medical, and other scientific researches as well as throughout architecture and business management. Bubble charts are often used during the early stages of product development to visualize thoughts and ideas for the purpose of sketching out a development plan. ConceptDraw PRO allows you to draw a bubble diagrams using the Bubble Diagrams solution.- Bubble Chart | How To Make a Bubble Chart | How to Draw a ...
- Bubble Chart Examples
- Bubble Chart Sample
- Venn Diagram Bubble Chart Example
- Bubble Chart | How To Create a Bubble Chart | Bubble Charts ...
- Examples Of Bubble Charts
- Organizational Bubble Chart
- How To Make a Bubble Chart | How To Create a Bubble Chart ...
- HR Flowchart Symbols | Bubble Chart | Example Of Motivation Icons
