Venn Diagram Examples for Problem Solving. Venn Diagram as a Truth Table
Venn diagrams are illustrations used in the branch of mathematics known as set theory. They show the mathematical or logical relationship between different groups of things (sets). A Venn diagram shows all the possible logical relations between the sets.
 Event-driven Process Chain Diagrams
Event-driven Process Chain (EPC) Diagram is a type of flowchart widely used for modeling in business engineering and reengineering, business process improvement, and analysis. EPC method was developed within the Architecture of Integrated Information Systems (ARIS) framework.
Venn Diagram Examples for Problem Solving
Venn diagrams are illustrations used in the branch of mathematics known as set theory. They show the mathematical or logical relationship between different groups of things (sets). A Venn diagram shows all the possible logical relations between the sets.HelpDesk
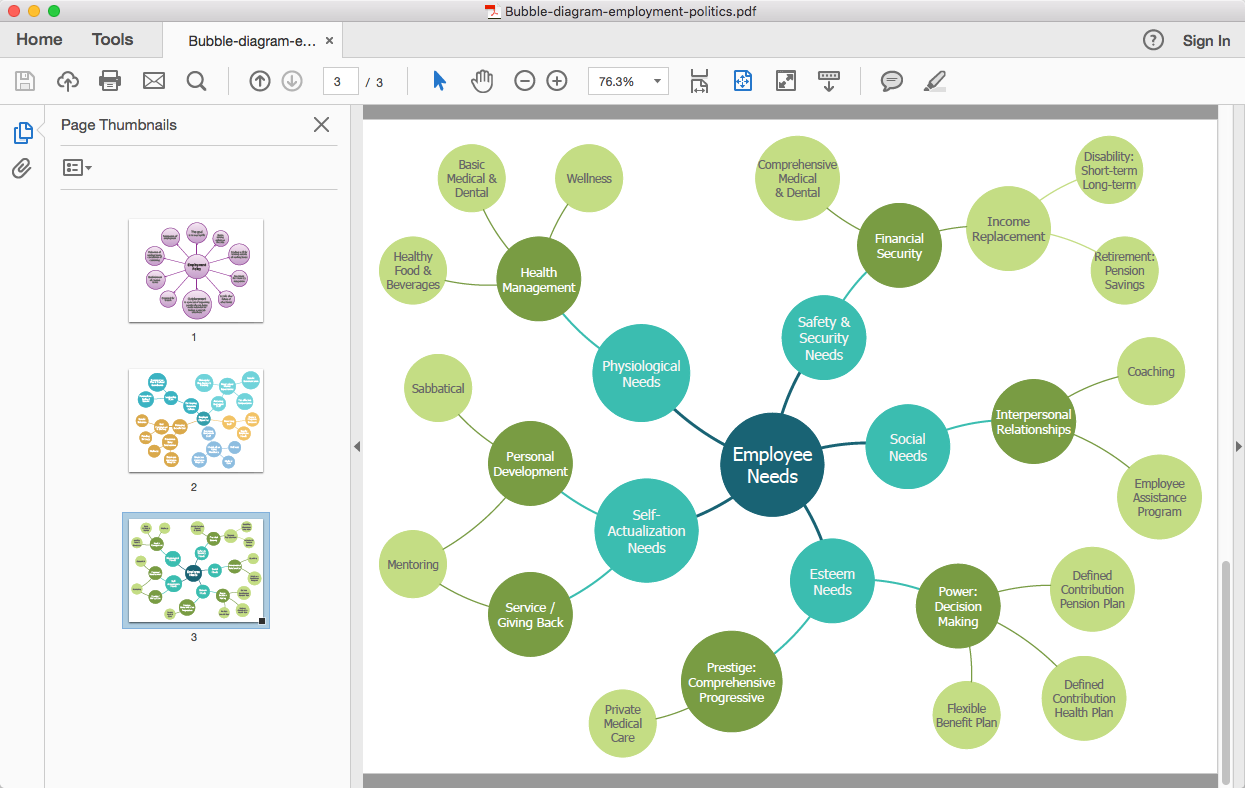
How To Convert a Bubble Diagram to Adobe PDF
ConceptDraw PRO allows you to easy share your business documentation between different computers with different operating systems and applications using it's export capabilities. You can get your bubble diagrams in pdf format and freely communicate them with others.HelpDesk
How to Create a Bubble Diagram Using ConceptDraw PRO
Bubble Diagram is a simple chart that consists of circles (bubbles) repesening certain topics or processes. Bubbles are connected by lines depicting the type of relationships between the bubbles. The size of each bubble is depended on the importance of the entity it represents. Bubble charts are widely used throughout social, economical, medical, and other scientific researches as well as throughout architecture and business management. Bubble charts are often used during the early stages of product development to visualize thoughts and ideas for the purpose of sketching out a development plan. ConceptDraw PRO allows you to draw a bubble diagrams using the Bubble Diagrams solution.Fire Exit Plan. Building Plan Examples
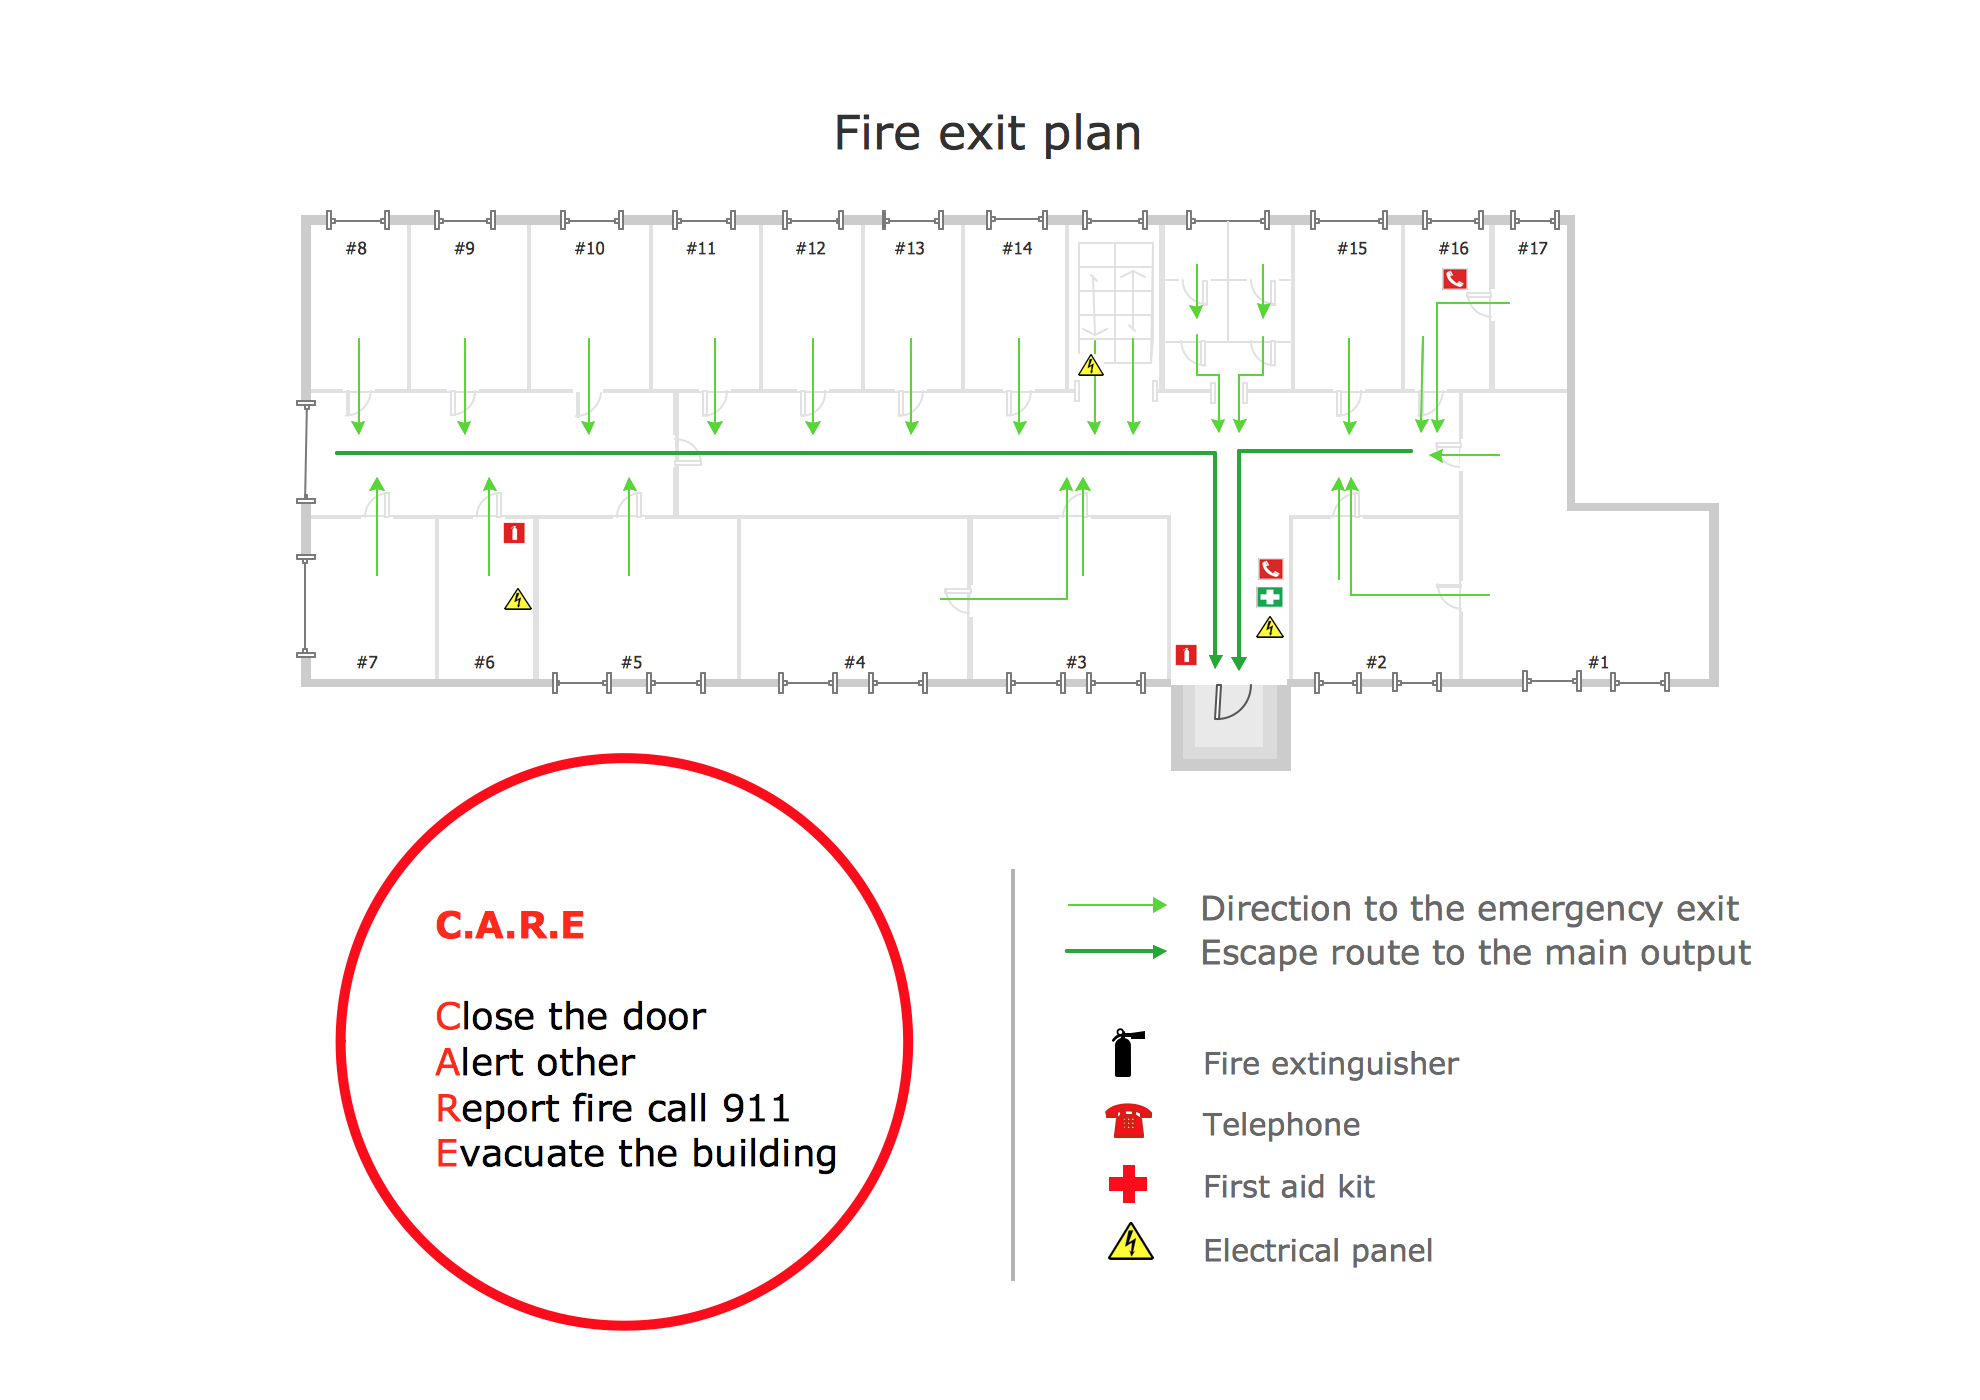
Fire exit plan or Emergency exit plan is an obligatory scheme for schools, universities, hospitals, hotels, business centers, metro, airports, and a lot of other buildings, public and private institutions. Fire exit plan depicts detailed plan of the building with marked emergency exits on it and helps to implement faster evacuation in various emergencies such as a fire. If a regular exit is blocked by fire, the plan helps to find the alternative exits, on the route to which are placed the signs leading to it. Fire and Emergency Plans solution from the Building Plans area of ConceptDraw Solution Park provides examples and samples, Fire and Emergency Plan quick-start template and vector stencils library with fire-fighting equipment design elements for drawing different types of emergency and fire schemes and plans: Evacuation plans, Fire Exit plans, Home Emergency plans, School Emergency plans, Office Emergency plans, Fire Emergency plans, Fire Evacuation plans, Fire Safety diagrams, Business Emergency plans, etc.ERD Symbols and Meanings
Entity Relationship Diagram (ERD) is a popular software engineering tool for database modeling and illustration the logical structure of databases, which uses one of two notations - Chen's or Crow’s Foot. Crow's foot notation is effective when used in software engineering, information engineering, structured systems analysis and design. Each of these notations applies its own set of ERD symbols. Crow's foot diagrams use boxes to represent entities and lines between these boxes to show relationships. Varied shapes at the ends of lines depict the cardinality of a given relationship. Chen's ERD notation is more detailed way to represent entities and relationships. ConceptDraw PRO application enhanced with all-inclusive Entity-Relationship Diagram (ERD) solution allows design professional ER diagrams with Chen's or Crow’s Foot notation on your choice. It contains the full set of ready-to-use standardized ERD symbols and meanings helpful for quickly drawing, collection of predesigned ERD samples, examples and templates. ConceptDraw Pro is a great alternative to Visio for Mac users as it offers more features and can easily handle the most demanding professional needs.
 People
This solution extends ConceptDraw PRO software with samples, templates and libraries of vector clipart for drawing the People illustrations. Use it to make professional-looking documents, presentations and websites illustrated with color scalable vector c
 Entity-Relationship Diagram (ERD)
Entity-Relationship Diagram (ERD) solution extends ConceptDraw PRO software with templates, samples and libraries of vector stencils from drawing the ER-diagrams by Chen's and crow’s foot notations.
Bar Diagrams for Problem Solving. Create manufacturing and economics bar charts with Bar Graphs Solution
Create bar charts for visualizing problem solving in manufacturing and economics using the ConceptDraw PRO diagramming and vector drawing software extended with the Bar Graphs Solution from the Graphs and Charts area of ConceptDraw Solition Park.
 Crow's Foot Notation
Crow’s Foot Notation solution extends ConceptDraw PRO software with powerful drawing tools, samples and library of predesigned vector Crow's Foot notation icons to help you easy describe the databases using the Entity-Relationship models and design professional-looking ER diagrams based on the popular Crow's Foot notation.
Cross-Functional Flowchart
Use of Cross-Functional Flowchart is a clear way of showing each team member’s responsibilities and how processes get shared or transferred between different responsible people, teams and departments. Use the best flowchart maker ConceptDraw PRO with a range of standardized cross-functional flowchart symbols to create the Cross-Functional Flowcharts simply and to visualize the relationship between a business process and the functional units responsible for that process. To draw the most quickly Cross-Functional Flowcharts, Cross Functional Process Maps, or Cross Functional Process Flow Diagrams, start with a Cross-functional flowchart samples and templates from ConceptDraw Solution Park. The ConceptDraw Arrows10 and RapidDraw technologies will be also useful for you in drawing. ConceptDraw PRO supports designing both types - horizontal and vertical Cross-functional flowcharts. A vertical layout makes the accents mainly on the functional units while a horizontal layout - on the process. If you need a Visio alternative in Mac OS X, try ConceptDraw PRO. Its interface is very intuitive and it’s actually much easier to use than Visio, yet somehow it’s just as powerful if not more so. ConceptDraw PRO performs professional quality work and seamless Visio interaction.
 Business Process Workflow Diagrams
The Business Process Workflow Diagrams solution enhances the ConceptDraw PRO v10 functionality with predesigned examples, samples and a numerous collection of predesigned vector objects of workflow chart elements, icons, arrows, connectors, and varied wor
- Bubble Diagram Wikipedia
- Booch OOD Diagram | ORM Diagram | Bubble Chart | Gantt Chart Wiki
- Bubble diagrams in Landscape Design with ConceptDraw PRO ...
- PageRank | Bubble Chart | Bubble Chart Maker | Pagerank Wiki
- McKinsey 7S framework | Bubble Diagrams | Mckinsey Wikipedia
- McKinsey 7S framework | Mckinsey 7s Wiki
- Bubble diagrams with ConceptDraw PRO | Bubble diagrams in ...
- Hydraulic circuits | Hydroullic Power Pack Diagram Wiki
- Multiple Bar Diagram Wikipedia
- Petroleum Refining Process Flow Diagram
- McKinsey 7S framework | Bubble Charts | Bubble Diagrams ...
- McKinsey 7S framework - Bubble diagram | Bubble Charts | Bubble ...
- Resources and TEAF Work Products for EA Direction, Description ...
- Bubble Diagrams | C4ISR architecture framework - IDEF0 activity ...
- McKinsey 7S framework | Bubble Charts | Bubble Diagrams | 7s ...
- Diagrams Of Direction
- Elements location of a welding symbol | Bubble diagrams in ...
- Employment Form Software | Post Employment Committee ...
- Active Directory diagram - Site links | Bubble diagrams with ...


