Bubble diagrams in Landscape Design with ConceptDraw DIAGRAM
Bubble Diagrams are the charts with a bubble presentation of data with obligatory consideration of bubble's sizes. They are analogs of Mind Maps and find their application at many fields, and even in landscape design. At this case the bubbles are applied to illustrate the arrangement of different areas of future landscape design, such as lawns, flowerbeds, playgrounds, pools, recreation areas, etc. Bubble Diagram helps to see instantly the whole project, it is easy for design and quite informative, in most cases it reflects all needed information. Often Bubble Diagram is used as a draft for the future landscape project, on the first stage of its design, and in case of approval of chosen design concept is created advanced detailed landscape plan with specification of plants and used materials. Creation of Bubble Diagrams for landscape in ConceptDraw DIAGRAM software is an easy task thanks to the Bubble Diagrams solution from "Diagrams" area. You can use the ready scanned location plan as the base or create it easy using the special ConceptDraw libraries and templates.HelpDesk
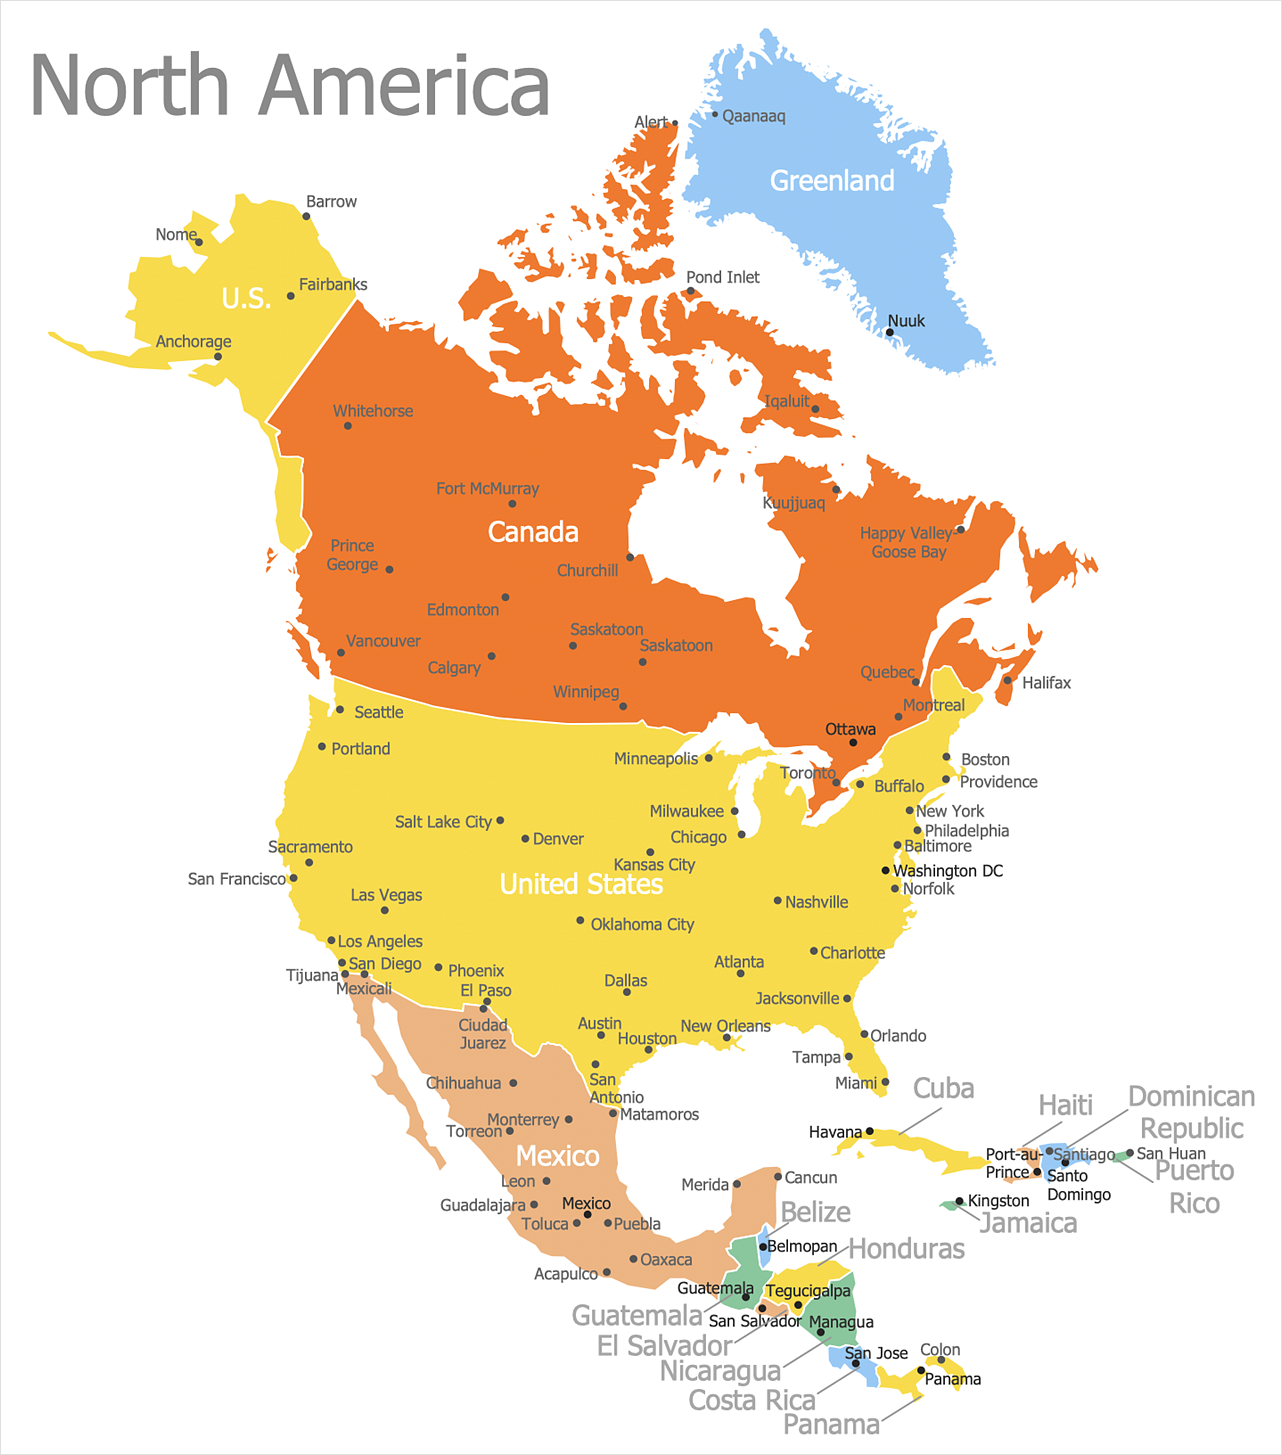
How to Draw a Map of North America
Geographic maps, cardiograms, and thematic maps are often used for geographical visualization of business information. Any country can inspire a wealth of geopolitical statistical data. A common way of assimilating this data is to create maps that convey a particular theme or subject matter in relation to a specific geographical area. Known as thematic maps, they cover themes such as population density, average rainfall, or political allegiance, differentiating the data by using graphical elements and annotation. Thematic maps contrast general reference maps, which tend to display information on a variety of subjects — vegetation, topology, roads, and highways, for example. A thematic map will always focus on one particular subject matter. ConceptDraw DIAGRAM can be helpful as a tool for creating maps of countries and regions of the world. It allows you to draw continental maps quickly and easily using the special templates and vector stencils libraries.HelpDesk
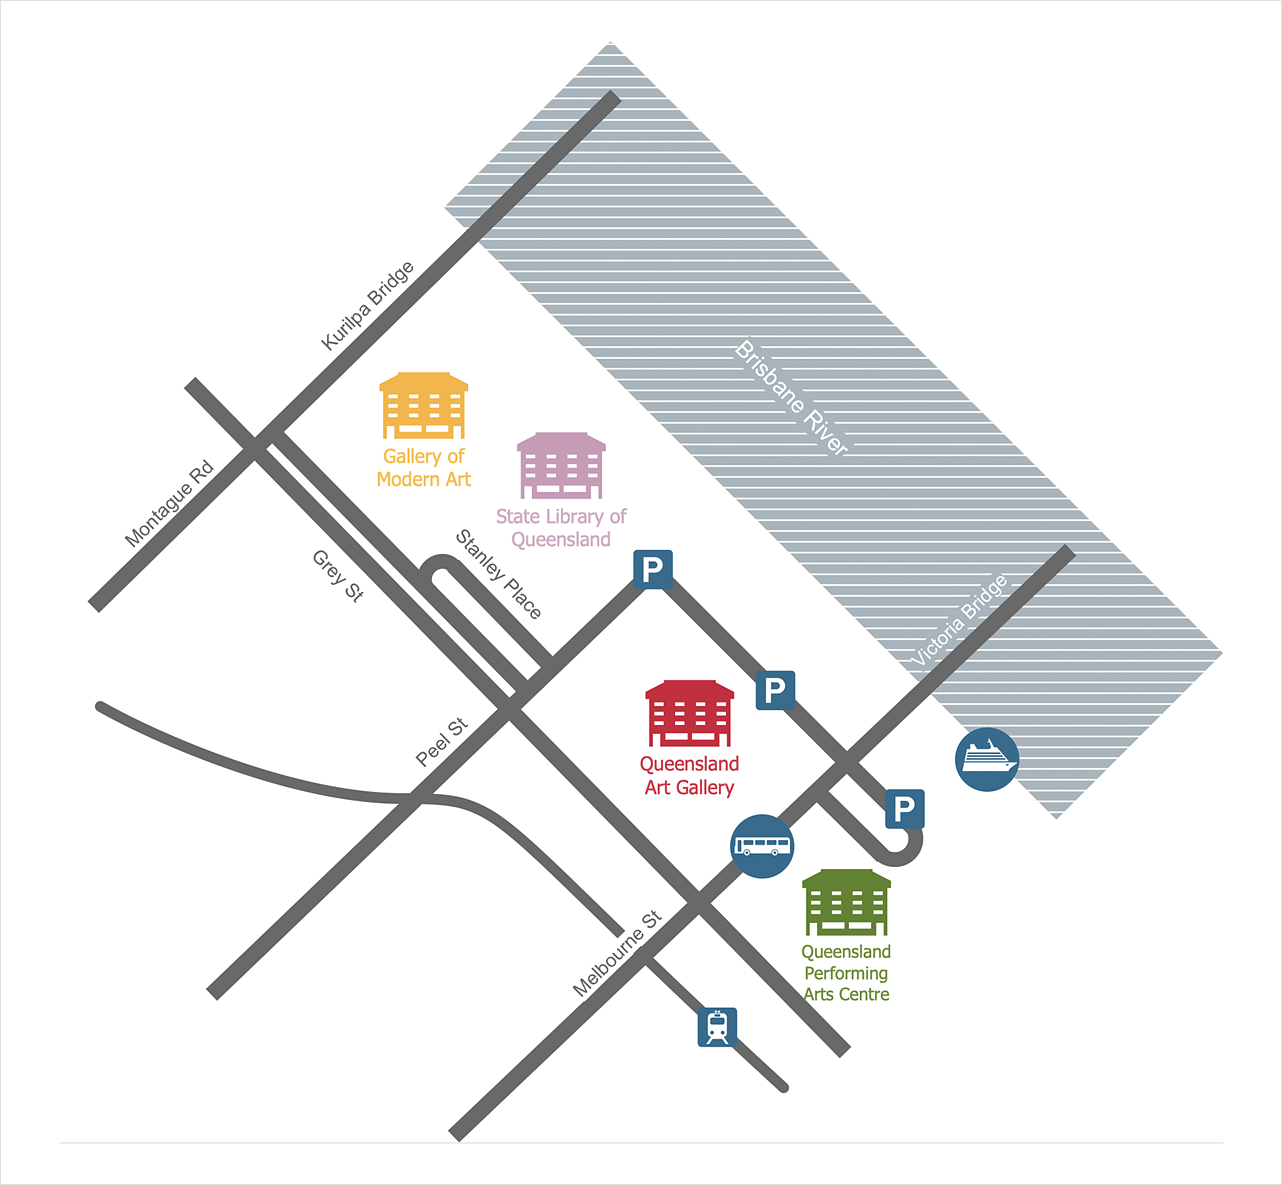
How to Create a Directional Map
Travelers often use directional maps to find directions for certain places. These maps are guiding millions of tourists to explore towns and cities worldwide. Searching addresses on a map, view nearby businesses, get driving directions - this is only a little of what directional maps is needed. ConceptDraw DIAGRAM allows you to create various kinds of directional maps. You can easily visualize city maps or destinations with driving directions and traveler information using special vector stencils libraries.HelpDesk
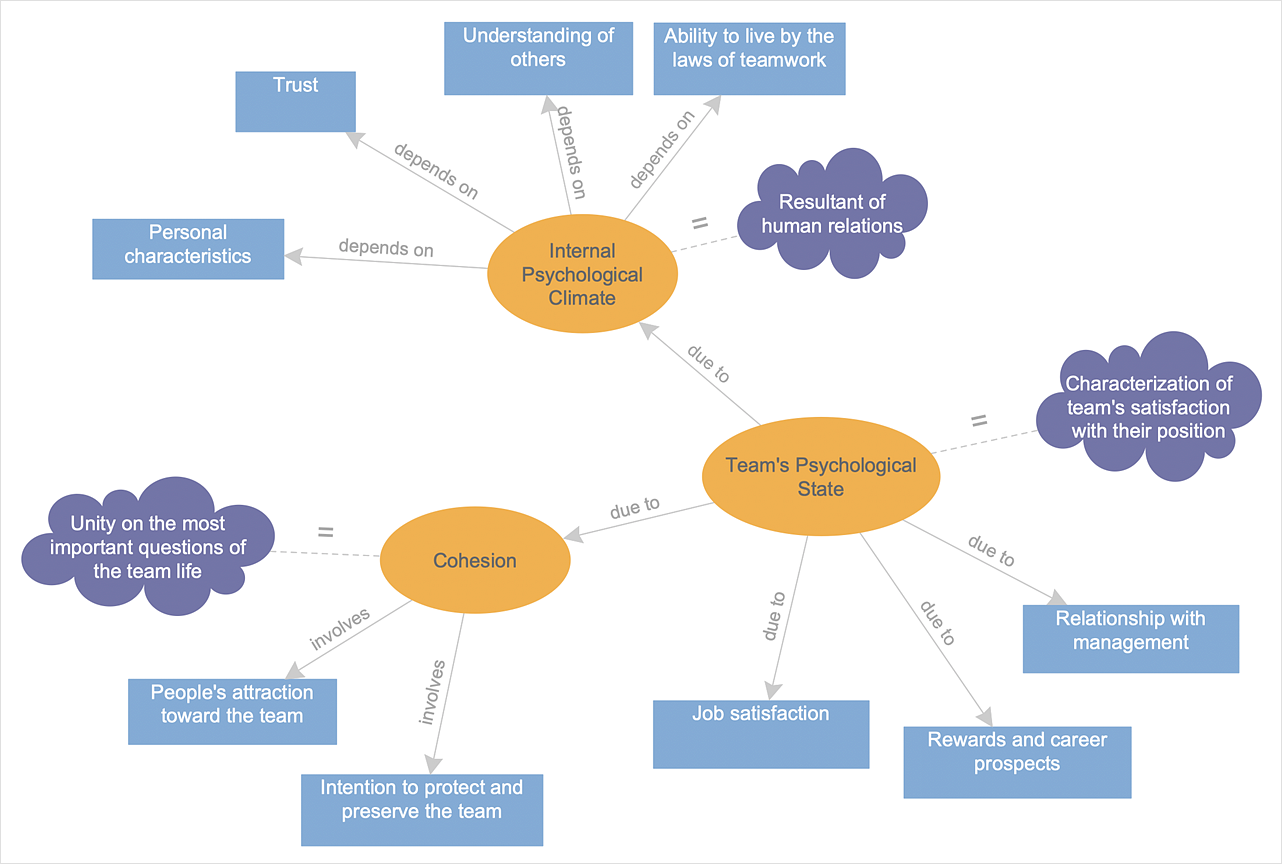
How to Create a Concept Map
The graphical technique of knowledge representation in the form of structured networks of concepts (ideas) is called concept mapping. Concept network consists of shapes that represent concepts and connectors representing relationships between concepts. The difference between mind maps and concept maps is that a mind map has only one object depicting the main idea, while a concept map may have several. Concept mapping is used to structure ideas, to communicate a complex system of knowledge, to help the learning process, etc. ConceptDraw DIAGRAM allows you to draw concept maps using the Concept Map solution.- Bubble Map Generator
- Bubble Map Maker | Bubble diagrams with ConceptDraw PRO | How ...
- Concept Map Maker | Bubble Map Maker | How To Make a Concept ...
- Concept Map Maker | Concept Map Maker | Bubble Map Maker ...
- Bubble Chart Maker
- Bubble Chart Maker | How To Create a Bubble Chart | Bubble ...
- Bubble Map Maker
- Emergency Plan | Bubble Map Maker | How To Create Restaurant ...
- Concept Map Maker | Bubble Chart Maker | Bubble Diagrams | Free ...
- Bubble Map Maker | How To Make a Concept Map | Bubble ...
- Concept Map Maker | How To Make a Concept Map | Concept Map ...
- Process Flowchart | Cross-Functional Flowchart | Bubble Map Maker ...
- Concept Map Maker | Bubble Map Maker | The Best Flowchart ...
- Nursing Concept Map Creator Free
- Bubble Diagrams | Bubble Map Maker | SWOT and TOWS Matrix ...
- Bubble Map Maker | How To Create a Bubble Chart | Cross ...
- Concept Map Creator Online
- Concept Map Maker | Mind Map Making Software | Quality ...
- SWOT Analysis Solution - Strategy Tools | Bubble Map Maker ...


