Bubble Chart Maker

Basic Flowchart Symbols and Meaning


Four Dimensions Bubble Plot

This sample clearly shows the Four Dimensions Bubble Diagram of the distribution of chlorine contaminant in the water source. This Bubble Diagram is very useful in the chemistry, hydrology, and ecology.
The Best Flowchart Software Available

ConceptDraw DIAGRAM vector diagramming and business graphics software enhanced with with templates, green and interactive flowchart makers, samples and stencil libraries from ConceptDraw Solution Park which all focused to help with drawing flowcharts, block diagrams, bar charts, histograms, pie charts, divided bar diagrams, line graphs, area charts, scatter plots, circular arrows diagrams, Venn diagrams, bubble diagrams, concept maps, and others.

 Education Package
Education Package is a comprehensive set of multifarious graphical solutions from ConceptDraw Solution Park, collected together in help to ConceptDraw DIAGRAM users working in a field of science, education and training, which is aimed at improving the quality of education and helping to design with ease variety of interesting and colorful educational materials, diagrams, charts and maps. Use it to present the information and knowledge in an interesting, clear, structured and simple form to achieve a success in education and pedagogy, to maintain the interest of students and pupils throughout the whole learning process, at the lectures, lessons and even during independent work with additional materials, to contribute to better perception of scientific information by listeners during the conferences and reports.
3 Ways to Quickly Create Excellent Presentations
Venn Diagram Examples for Problem Solving. Environmental Social Science. Human Sustainability Confluence

Create your Venn diagrams for problem solving in environmental social science using the ConceptDraw DIAGRAM diagramming and vector drawing software extended with the Venn Diagrams solution from the area "Diagrams" of ConceptDraw Solution Park.
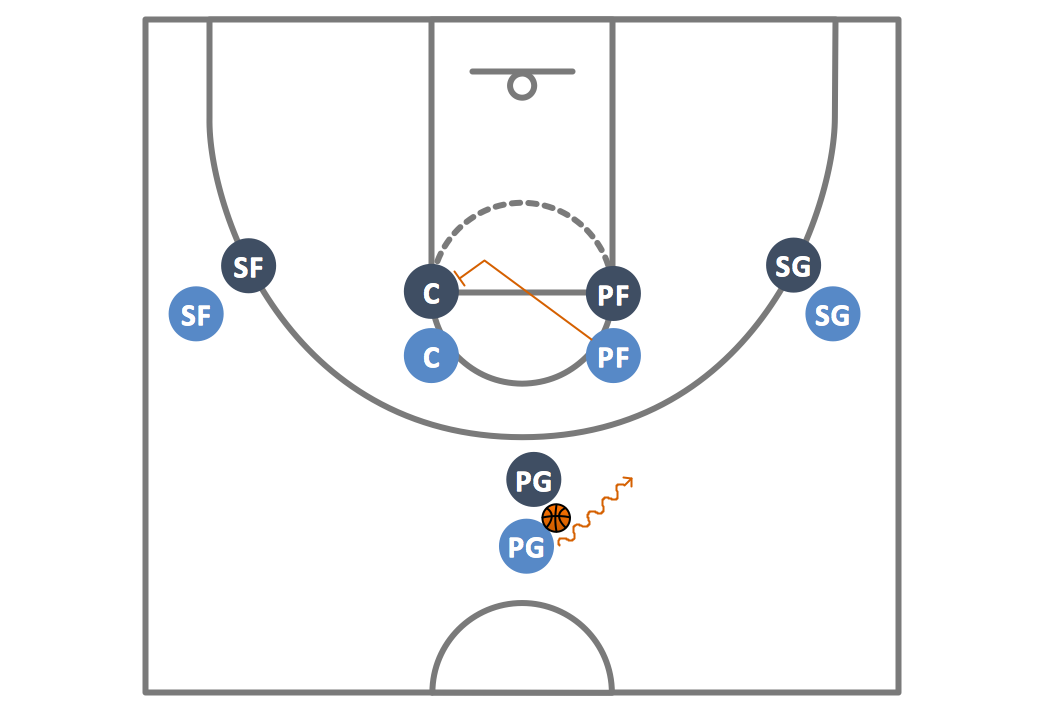
Basketball Plays Diagrams
Internet solutions with ConceptDraw DIAGRAM

Best Diagramming


- Bubble Map Maker | ConceptDraw Solution Park | Ice Hockey Rink ...
- Bubble Map Printable
- Bubble Map Maker | Bubble diagrams with ConceptDraw PRO | How ...
- Ice Hockey Rink Diagram | Hockey Rink Printable
- Printable Hockey Rink Diagram
- Flowchart Examples and Templates | Bubble Diagrams | ATM UML ...
- Venn Diagram With Lines Free Printable
- Bubble Chart Maker | Bubble Diagrams | Bubble Chart | Free Blank ...
- Concept Map Maker | Concept Mapping | How To Make a Concept ...
- USA Maps | Bubble Diagram For Township
- ERD | Entity Relationship Diagrams, ERD Software for Mac and Win
- Flowchart | Basic Flowchart Symbols and Meaning
- Flowchart | Flowchart Design - Symbols, Shapes, Stencils and Icons
- Flowchart | Flow Chart Symbols
- Electrical | Electrical Drawing - Wiring and Circuits Schematics
- Flowchart | Common Flowchart Symbols
- Flowchart | Common Flowchart Symbols