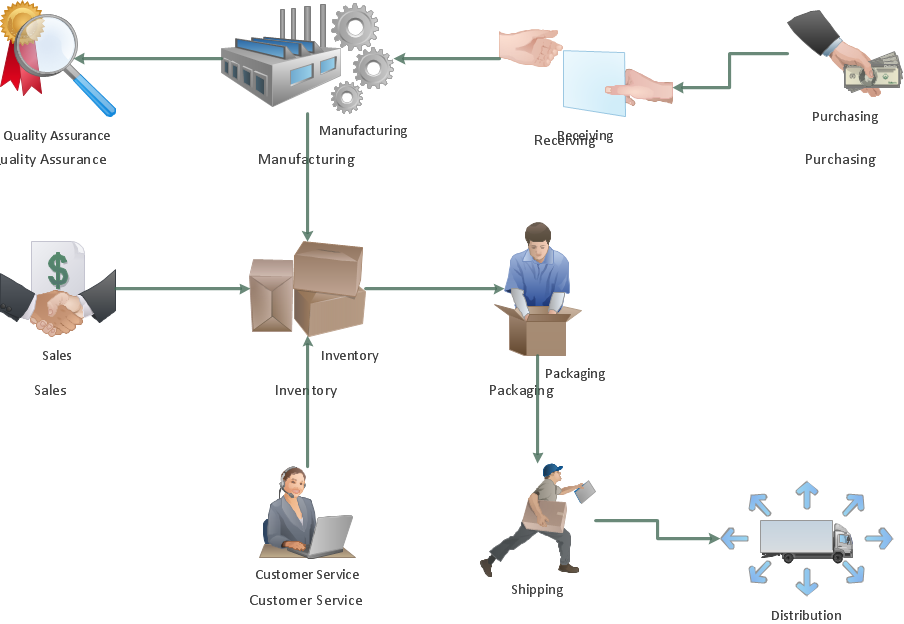
Flow chart Example. Warehouse Flowchart
Warehouse Flowcharts are various diagrams that describe the warehousing and inventory management processes on the warehouses. Typical purposes of Warehouse Flowcharts are evaluating warehouse performance, measuring efficiency of customer service and organizational performance. This type of Workflow diagrams can be used for identifying any disconnection between business activities and business objectives. They are effectively used by warehouse-related people and organizations, manufacturers, wholesalers, exporters, importers, transporters, and others. Standard Warehousing process flow diagram and standard Workflow diagram are used for process identification for further evaluating effectiveness and profitability of overall business process. Use the ConceptDraw PRO vector graphic software extended with Flowcharts solution to design your own professional-looking Workflow diagrams and Flowcharts of any types, including the Warehouse flowchart, Process flow diagrams which depict in details all steps of Warehouse packages flow. Microsoft Visio, designed for Windows users, can’t be opened directly on Mac. But fortunately, there are several Visio alternatives for Mac which will help Mac users to work Visio files. With ConceptDraw PRO, you may open, edit and save files in Visio format.
Examples Flowchart
ConceptDraw PRO diagramming and vector drawing software provides the unique Flowcharts Solution from the "Diagrams" Area of ConceptDraw Solution Park with variety of vector objects libraries and collection of examples Flowchart. Each example flowchart included in Flowcharts solution is a real help in drawing process, it can be the good base or perfect source of inspiration.
Flowchart Software
Flowchart is a simple diagram, map or graphical schematic representation the sequence of actions within a process. It is ideal for displaying how a process currently flows or can function ideally. The Flowcharts let define the steps and boundaries of a process, uncover problems or miscommunications. The Flowcharts are widely used in education, software development, business, economics, thanks to their visuality they are ideal for presentations, reports, for using on conferences to help the audience comprehend the content better, or easy find flaws in a process flow diagrams. ConceptDraw PRO is professional flowcharts software and feature-rich flowchart maker, which supports Mac OS X and Windows. It contains at ConceptDraw Solution Park a rich set of stencils and professional flowchart symbols for design. It lets create simply professional-looking Flowcharts based on thousand free flowchart templates, colored symbols and examples. ConceptDraw PRO is a 3 times cheaper alternative to MS Visio available for both Mac and PC. It’s is another full featured business and technical diagramming application that can easily take care of Visio files within OS X. Another bonus with ConceptDraw PRO – it's cross-platform. You can work on a document in both OS X and Windows, skipping Visio entirely.
HelpDesk
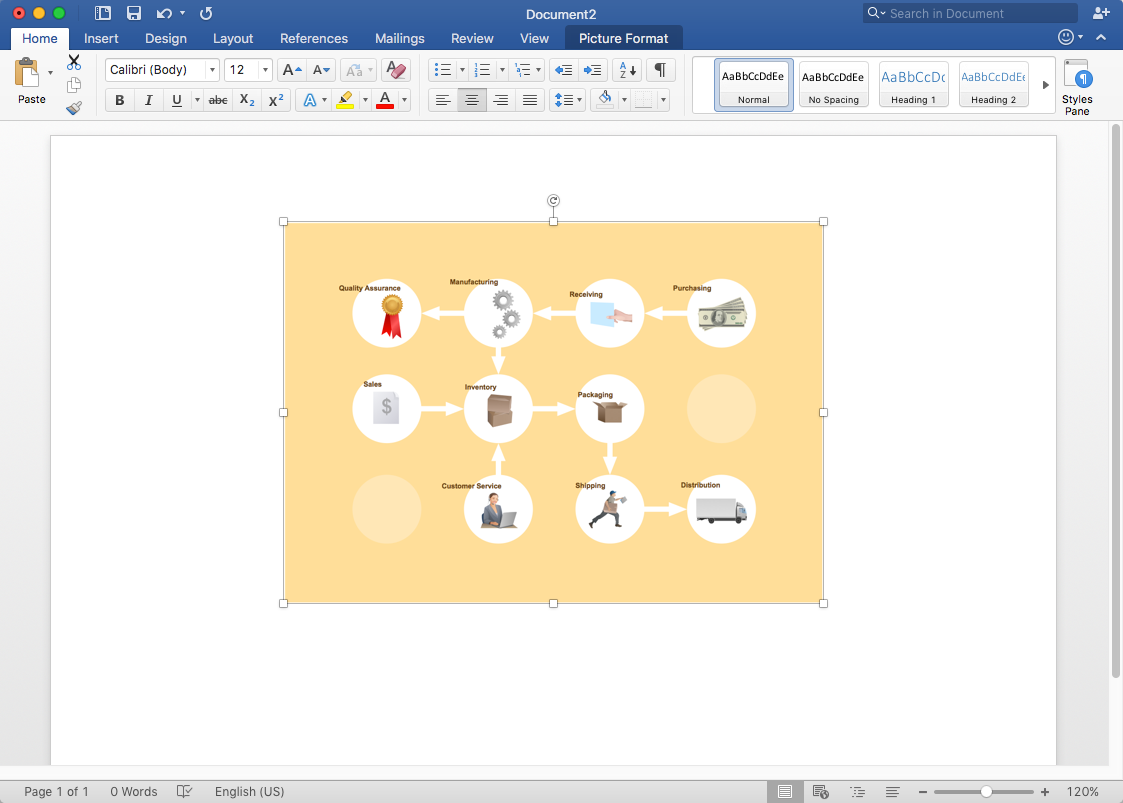
How to Add a Workflow Diagram to MS Word Document
ConceptDraw PRO allows you to easily create workflow diagrams and then paste them into a MS Word document.
 Manufacturing and Maintenance
Manufacturing and maintenance solution extends ConceptDraw PRO software with illustration samples, templates and vector stencils libraries with clip art of packaging systems, industrial vehicles, tools, resources and energy.
 Workflow Diagrams
Workflow Diagrams solution extends ConceptDraw PRO software with samples, templates and vector stencils library for drawing the work process flowcharts.
 Fishbone Diagrams
The Fishbone Diagrams solution extends ConceptDraw PRO v10 software with the ability to easily draw the Fishbone Diagrams (Ishikawa Diagrams) to clearly see the cause and effect analysis and also problem solving. The vector graphic diagrams produced using this solution can be used in whitepapers, presentations, datasheets, posters, and published technical material.
ConceptDraw Arrows10 Technology
New Smart connectors in ConceptDraw PRO now have an auto-routing feature. This means that connectors always find the optimal route between objects and automatically recalculate that path when moving these objects. You don't have to think about your connectors, they think for you.Create a Presentation Using a Design Template
The intuitive interface of ConceptDraw MINDMAP and the Functional Tools overview below will guide you in creating and demonstrating powerful mind map presentations using template. An advanced tool allows you effectively generate, change, and update your presentation.- Flow chart Example. Warehouse Flowchart | Packaging , loading ...
- Flow chart Example. Warehouse Flowchart | Bubble diagrams in ...
- Organogram Software | Flow chart Example. Warehouse Flowchart ...
- Bubble Chart | Human Resource Development | Flow chart Example ...
- Basic Flowchart Symbols and Meaning | Conceptual diagram of the ...
- Flow chart Example. Warehouse Flowchart | Food security ...
- Manufacturing and Maintenance | Divided Bar Diagrams | Bubble ...
- Illustration | Design elements - Tools | How To Create a Bubble ...
- Fishbone Diagrams | HR Flowcharts | Bubble Diagrams | Company ...
- Process Engineering | Flow chart Example. Warehouse Flowchart ...
- Types of Flowcharts | Divided Bar Diagrams | Target and Circular ...
- Target and Circular Diagrams | Trading process diagram ...
- Flowchart design. Flowchart symbols, shapes, stencils and icons ...
- Conceptual diagram of the Kanban System | Kanban Board ...
- Flow chart Example. Warehouse Flowchart | Plant Layout Plans ...
- Flow chart Example. Warehouse Flowchart | Warehouse security ...
- Flow chart Example. Warehouse Flowchart | Warehouse layout floor ...
- How to Add a Flowchart to a MS Word Document Using ...
- Flow Chart On Type Of Energy Audit Image
- Data Flow Diagram Model | Process Flowchart | Manufacturing 8 Ms ...


