Bubble diagrams in Landscape Design with ConceptDraw DIAGRAM
To define the links between the different areas of your own landscape design and see the project from aside, we recommend to draw landscape diagram called bubble one which is analogue of «mind maps» as it allows us to create approximate image of our future proper landscape view. Use special libraries (and we have plenty of them) with objects of landscape design to be able to create the detailed plan of your landscape which will be looking so smart and professionally good as the samples we provide were created by designers who know so much about making such kinds of design plans. Having ConceptDraw DIAGRAM as the assistant in your work, will ensure the success after using our product. Make the bubble diagrams as well as any other ones in minutes with ease having our application called ConceptDraw DIAGRAM and you will see how quick it will change your life simplifying lots of work.Bubble Diagrams
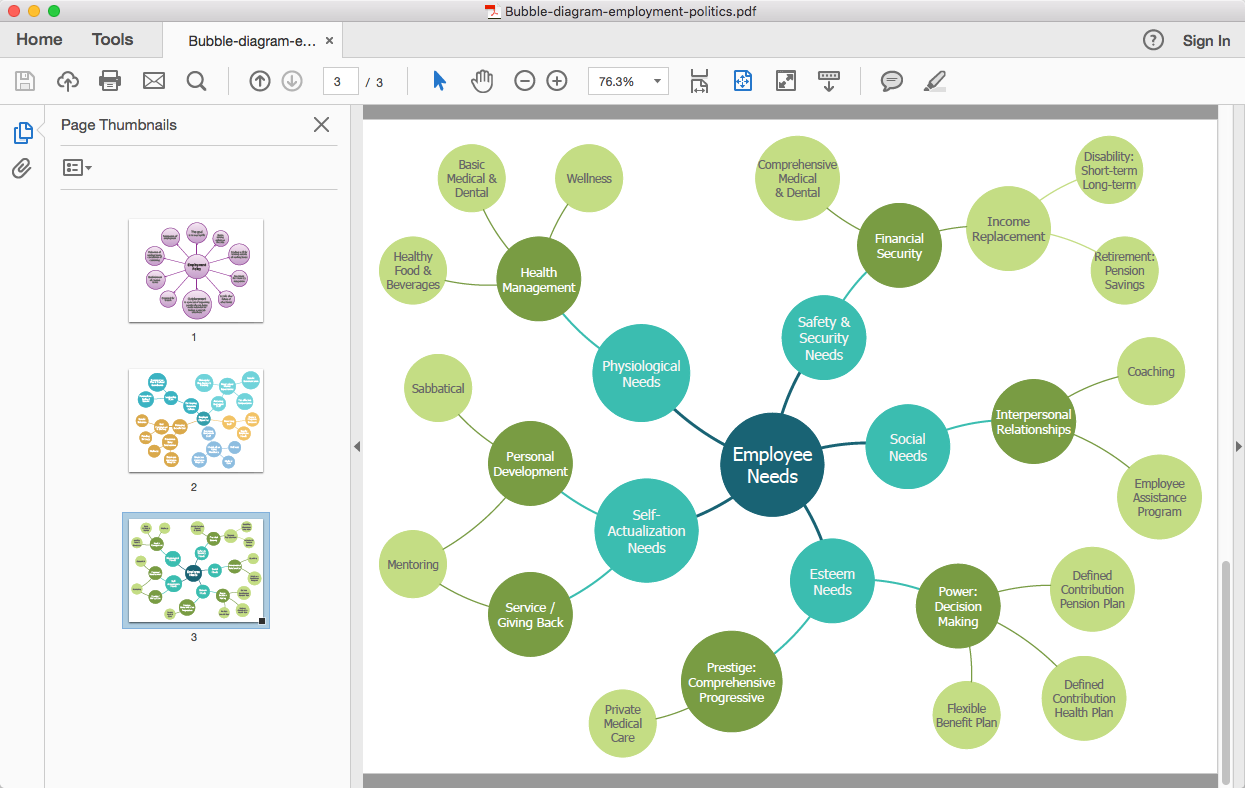
Bubble diagrams have enjoyed great success in software engineering, architecture, economics, medicine, landscape design, scientific and educational process, for ideas organization during brainstorming, for making business illustrations, presentations, planning, design, and strategy development. They are popular because of their simplicity and their powerful visual communication attributes.
HelpDesk
How to Create a Bubble Diagram
Bubble Diagram is a simple chart that consists of circles (bubbles) repesening certain topics or processes. Bubbles are connected by lines depicting the type of relationships between the bubbles. The size of each bubble is depended on the importance of the entity it represents. Bubble charts are widely used throughout social, economical, medical, and other scientific researches as well as throughout architecture and business management. Bubble charts are often used during the early stages of product development to visualize thoughts and ideas for the purpose of sketching out a development plan. ConceptDraw DIAGRAM allows you to draw a bubble diagrams using the Bubble Diagrams solution.HelpDesk
How to Add a Bubble Diagram to PowerPoint Presentation
Bubble diagrams can be used to compare concepts and identify areas of similarity and difference. ConceptDraw DIAGRAM allows you to make an MS PowerPoint Presentation from your charts in a few simple steps. A bubble diagram is a chart that represents information visually in the form of a series of bubbles. Bubble charts are often used in marketing and management during the early stages of product development to visualize ideas and concepts by organizing them in a hierarchy. The ability to create this form of a diagram is contained within the Bubble Diagrams solution. A PowerPoint presentation of bubble diagrams can be used to demonstrate and identify areas of similarity and difference of featured business ideas and concepts.HelpDesk
How to Add a Bubble Diagram to MS Word
A bubble diagram is used the same purpose as a scatter diagram, but in the case, if the data has three dimensions, each of that containing the set of values. A bubble chart is a diagram in which the data points are replaced with bubbles, and the size of the bubbles represents some additional dimension of the data. A bubble chart does not have the axis. The sizes of the bubbles are determined by the values in the third dimension. Any additional information about the entities beyond their three primary dimensions can be depicted by rendering bubbles in colors and patterns that are selected in a certain way. The legend containing the further information can be added to a bubble diagram. ConceptDraw DIAGRAM allows you to easily create various business management and marketing charts, including bubble diagrams and then add them to an MS Word document.HelpDesk
How To Create Visio Bubble Chart
ConceptDraw DIAGRAM allows you to easily create business charts and diagrams of any complexity, including the bubbles diagram and then make an MS Visio file from your diagram in a few simple steps.HelpDesk
How To Convert a Bubble Diagram to Adobe PDF
ConceptDraw DIAGRAM allows you to easily share your business documentation between different computers with different operating systems and applications using its export capabilities. You can get your bubble diagrams in pdf format and freely communicate them with others.- Bubble diagram - Employer objectives | How to Create a Bubble ...
- Bubble diagram template | Basic Diagramming | Best Diagramming ...
- Bubble diagrams in Landscape Design with ConceptDraw PRO ...
- Components of ER Diagram | Circle-Spoke Diagrams | Bubble ...
- Bubble Diagrams | Bubble diagrams with ConceptDraw PRO ...
- Pyramid Chart Examples | Bubble diagram template | Business ...
- Bubble diagram template
- What Are Examples Of Bubble Diagram
- Bubble diagram - Employment policy direction | Best Diagramming ...
- Bubble diagram - Employment policy direction
- Bubble diagrams with ConceptDraw PRO
- How To Create a Bubble Chart | Bubble diagrams in Landscape ...
- How to Draw a Bubble Chart | How To Create a Bubble Chart | How ...
- How To Create a Bubble Chart | Best Diagramming Software for Mac ...
- Bubble diagram - Employee needs
- McKinsey 7S framework - Bubble diagram
- Bubble diagram - Template
- Bubble Diagrams | Bubble diagrams in Landscape Design with ...
- How to Draw a Bubble Chart | How to Create a Bubble Diagram ...
- ERD | Entity Relationship Diagrams, ERD Software for Mac and Win
- Flowchart | Basic Flowchart Symbols and Meaning
- Flowchart | Flowchart Design - Symbols, Shapes, Stencils and Icons
- Flowchart | Flow Chart Symbols
- Electrical | Electrical Drawing - Wiring and Circuits Schematics
- Flowchart | Common Flowchart Symbols