HelpDesk
How To Create a PERT Chart
Project Evaluation and Review Technique (PERT) is a method of project tasks evaluation and analysis. PERT - is a method of analyzing the tasks required to complete the project. It includes analysis of the time required to complete each task, as well as the determination of the time required to carry out the whole project. PERT was developed to facilitate the planning of huge and complex projects. PERT is used for very large, complex, and non-standard projects. Technology implies the presence of uncertainty, making it possible to develop a schedule of the project without a precise information on details and time required for all of its components. The most popular part of PERT is a method of the critical path, based on the construction of the network schedule (PERT network diagram). ConceptDraw Office delivers you the best way to create PERT chart for your project using compatibility between ConceptDraw PROJECT and ConceptDraw PRO.HelpDesk
How to Draw an Organizational Chart Using ConceptDraw PRO
The organizational chart software is a valuable tool for modern business. It is important for any business to build a clear organizational structure that determines the responsibilities and relationships between different positions in the organization. The clear structured organization - means the clear structured business workflow, which is the core of success in the business. ConceptDraw PRO is an org chart software that allows you to draw an organizational structure of your company quickly and easily.HelpDesk
How to Make a Mind Map from a Project Gantt Chart
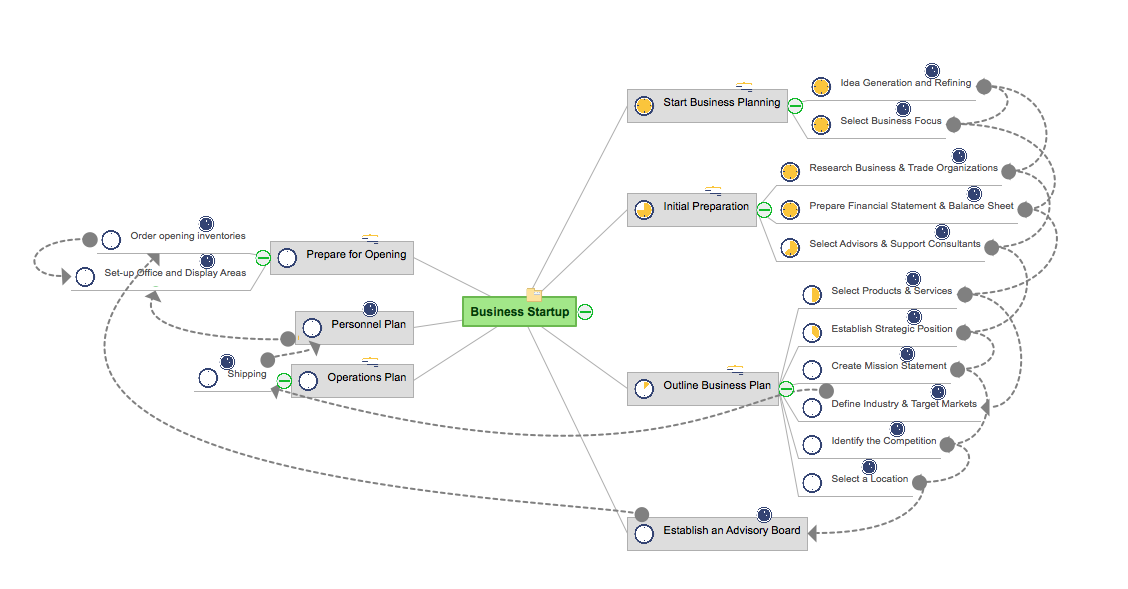
ConceptDraw Office allows you to see the project data from ConceptDraw PROJECT in a mind map structure by opening your project in ConceptDraw MINDMAP.HelpDesk
How to Create an Accounting Flowchart Using ConceptDraw Solution Park
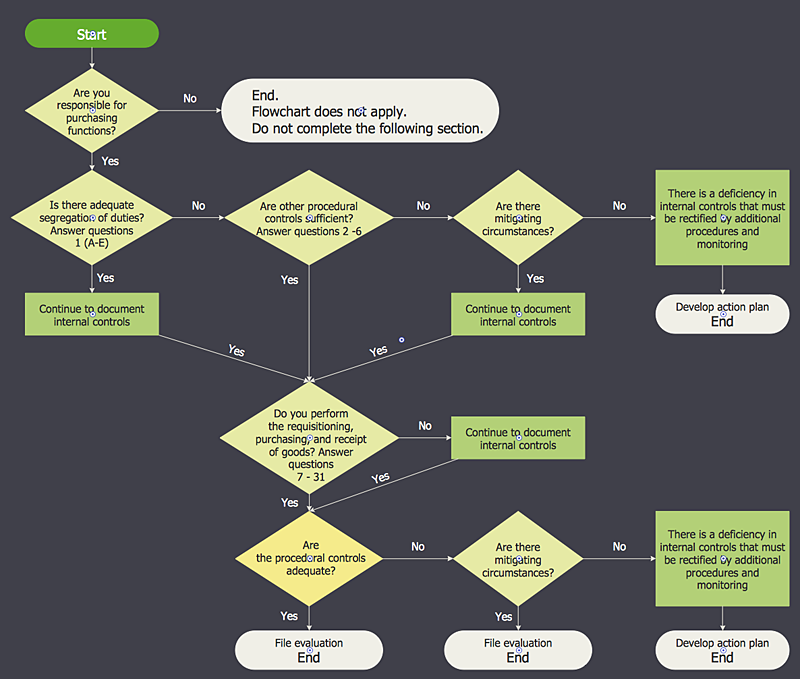
An Accounting flowchart is a specialized type of flowchart. With the help of an accounting flowchart you can visually describe tasks, documents, people responsible for execution at each stage of accounting workflow. Find out how you can easily create an accounting flowchart of any complexity using Accounting Flowchart Solution from the ConceptDraw Solution Park.HelpDesk
How to Create a Cross - Functional Flowchart Using ConceptDraw PRO
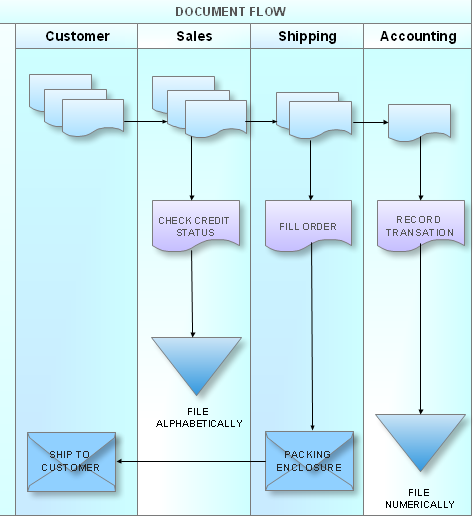
Cross-functional flowcharts are used to visualize cross-functional processes. Cross-functional process is a process that involves multiple divisions, each of which makes its part of the entire company workflow. For example: product development, lead management , client orders processing – and other critical processes. All of them are important both for business and customers, but the workflow and responsibilities distribution within these processes are divided between multiple departments and services. Cross-functional processes cannot be depicted with simple workflow diagrams, because of the specific interactions between company departments. ConceptDraw PRO has released the specialized solution to create cross-functional diagrams. Cross Functional Flowcharts solution includes a special set of templates and libraries to depict the cross-functional processes.
HelpDesk
How to Create an IDEF0 Diagram for an Application Development
IDEF0 methods are intended to model the functions of a process, creating a graphical model that displays: what controls the function, who makes it, what resources are used and how they are connected with other functions. The IDEF0 tool is used to model the decisions, actions, and activities of a software system during the development process . IDEF0 diagram graphically depicts a model of a desired version of the application. ConceptDraw PRO allows you to create and communicate the IDEF0 diagrams of any complexity.- Flow Chart Online | What is Interactive Flowcharts | How to Create a ...
- Flow Chart Online | How to Create a Social Media DFD Flowchart ...
- How to Create a Social Media DFD Flowchart | Flow Chart Online ...
- Flow Chart Online | Top 5 Android Flow Chart Apps | How To Create ...
- ConceptDraw Solution Park | Flow Chart Online | How to Create ...
- How To Create a PERT Chart | Flow Chart Online | How to Draw the ...
- Flow Chart Online | ConceptDraw Solution Park | How To Create a ...
- Flow Chart Online | How To Create a PERT Chart | Flow chart ...
- Make Charts Online
- Flow Chart Online | Online Flow Chart | How to Create a Timeline ...
- Flow Chart Online | How to Create a HR Process Flowchart Using ...
- Flow Chart Online | Top 5 Android Flow Chart Apps | ConceptDraw ...
- What is Interactive Flowcharts | Create Response Charts | How to ...
- Flow Chart Online | Online Flow Chart | Process Flowchart | Free ...
- Online Diagram Tool | Flow Chart Online | ConceptDraw Solution ...
- Flow Chart Online | Online Flow Chart | Program Evaluation and ...
- Flow Chart Online | ConceptDraw Solution Park | Amazon Web ...
- State Diagram Example - Online Store
- Flow Chart Online
- Process Flowchart | Flow Chart Online | Top 5 Android Flow Chart ...


