HelpDesk
How to Draw an Organizational Chart
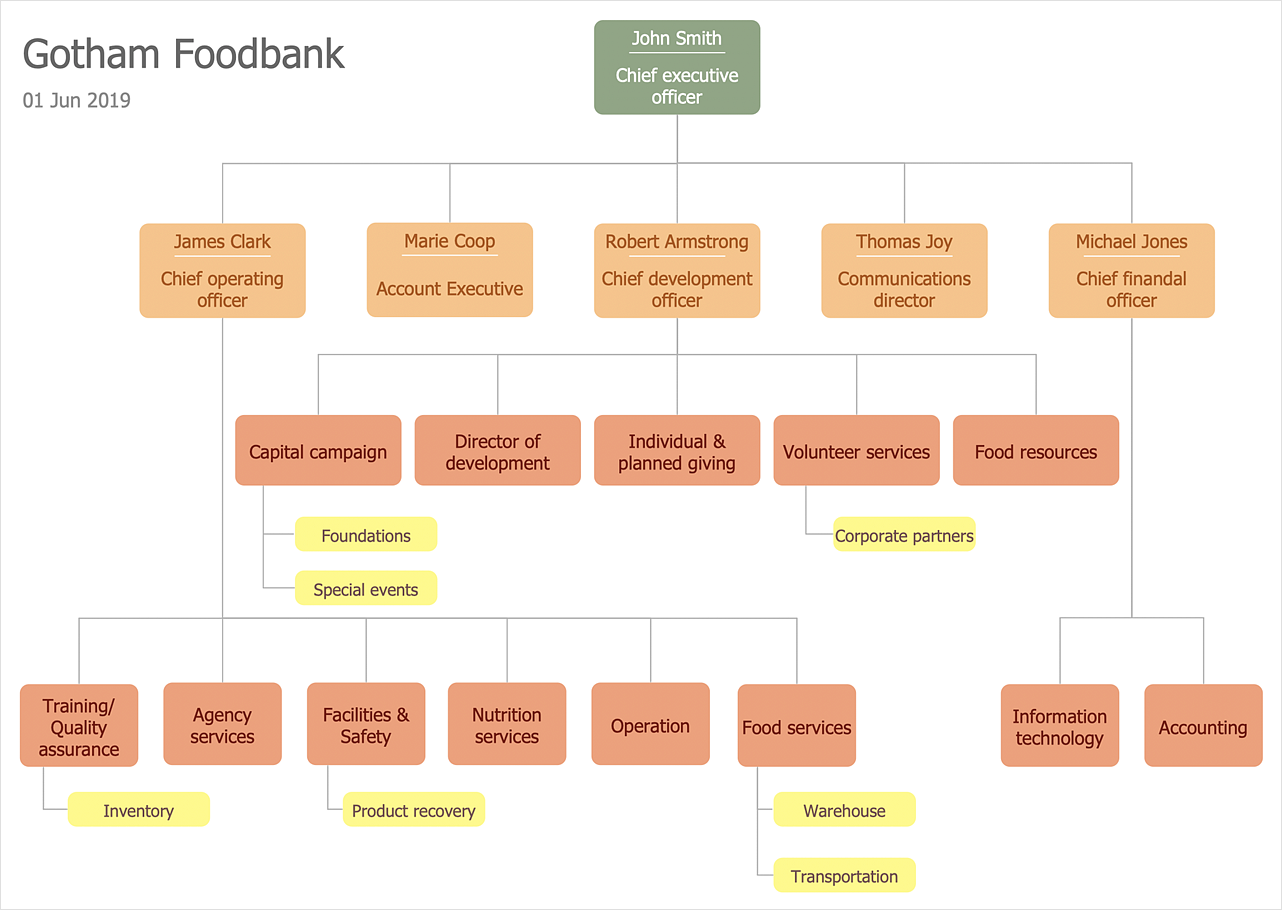
Polish your diagram appearance using the tools provided in the Format panel. The organizational chart software is a valuable tool for modern business. It is important for any business to build a clear organizational structure that determines the responsibilities and relationships between different positions in the organization. The clear structured organization - means the clear structured business workflow, which is the core of success in the business. ConceptDraw DIAGRAM is an org chart software that allows you to draw an organizational structure of your company quickly and easily.HelpDesk
How to Create an Active Directory Diagram
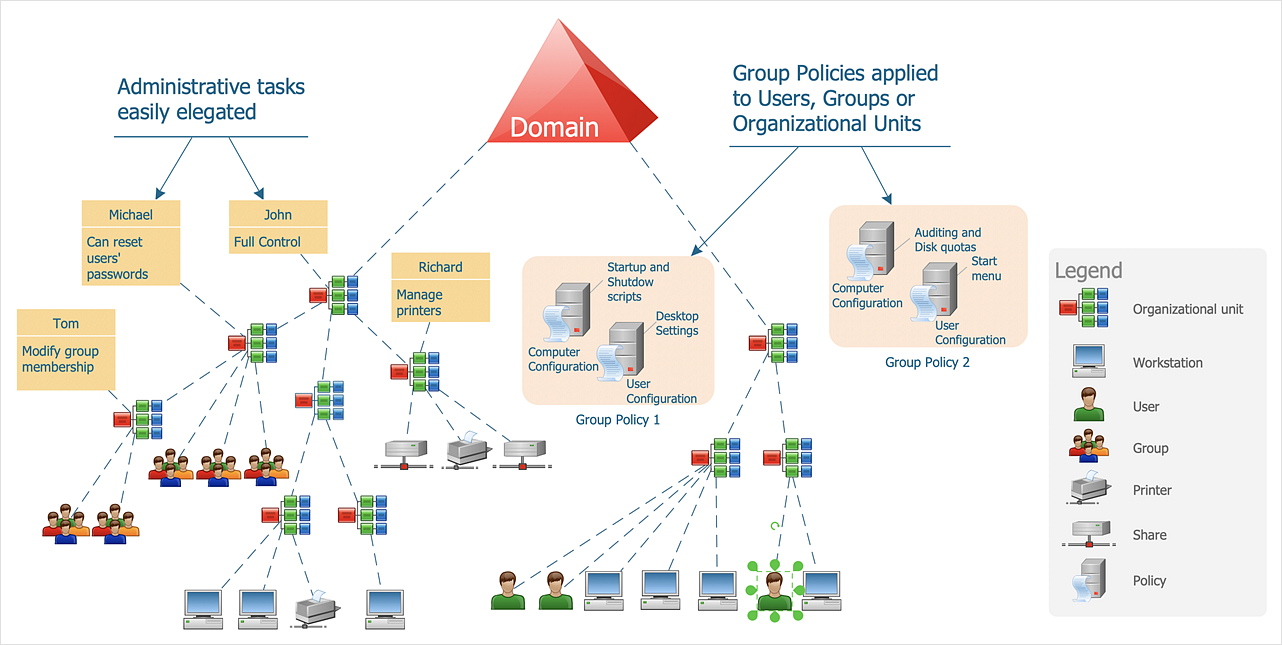
Active Directory Service represents a distributed database that contains all the domain objects. The Active Directory domain environment is a single point of authentication and authorization of users and applications across the enterprise. The domain of the organization and deployment of Active Directory Service are exactly the cornerstones of the enterprise IT infrastructure. The logical diagrams of MS Windows Active Directory structure are used to visually support an enterprise IT infrastructure planning and management. ConceptDraw DIAGRAM allows you to make AD Diagrams quickly and easily using the set of special libraries.
 Management
This solution extends ConceptDraw DIAGRAM and ConceptDraw MINDMAP with Management Diagrams and Mind Maps (decision making, scheduling, thinking ideas, problem solving, business planning, company organizing, SWOT analysis, preparing and holding meetings
HelpDesk
How to Create a Time Series Dashboard
Time Series Dashboard means integration of some type of diagrams: Line Charts, Bar Charts, Column Charts, and Dot Plots on a single space. The ConceptDraw Time Series Dashboard solution can be used to create the interactive Time Series dashboard. The libraries of Time Series Charts solution contain the Live Objects, that can change their appearance depending on the external data. Each chart from the Time Series dashboard displays particular source data. You can include Time Series Charts in your business or technical dashboards to show and compare the items changing over time.HelpDesk
How to Input Data from MS Excel Into a Mind Map
Many people apply Excel documents to store data in the form of hierarchical lists. With ConceptDraw MINDMAP you can easily turn the linear structure of an Excel table in a radial structure of mind map ConceptDraw MINDMAP will create a mind map file (CDMZ) from your Excel (XLS) file. If you keep your information in the Microsoft Excel files, you can import them into ConceptDraw MINDMAP, converting the columns and rows to a hierarchically structured mind map. If you have multiple individual sheets in your Excel workbook, ConceptDraw MINDMAP will turn them into a single multi-page mind map. ConceptDraw MINDMAP lets you import an entire Microsoft® Excel file as well as insert data from the selected cells.- How to Draw an Organization Chart | ConceptDraw PRO ...
- How to Create Organizational Chart Quickly | How to Draw an ...
- How to Draw an Organization Chart | Organizational Charts | How to ...
- Organizational Structure | How to Draw an Organizational Chart ...
- How to Draw an Organizational Chart Using ConceptDraw PRO ...
- How to Draw an Organization Chart | Horizontal Org Flow Chart ...
- Organizational Structure | How to Draw an Organization Chart ...
- Examples of Flowcharts, Org Charts and More | How to Draw an ...
- How to Draw an Organization Chart
- Organizational Chart Template | ConceptDraw PRO - Organizational ...
- How to Draw an Organization Chart | Organizational Charts with ...
- How to Draw an Organization Chart | How to Draw an ...
- It Deployment Functional Organizational Chart
- How to Draw an Organization Chart | How to Create Organizational ...
- Organization chart - Foodbank | How to Draw an Organization Chart ...
- How to Draw an Organization Chart | Draw Company Structure with ...
- How to Draw an Organization Chart | Organizational chart - County ...
- How to Draw an Organization Chart | Business diagrams & Org ...
- Organizational Charts | Network organization chart | How to Draw an ...
- How to Draw an Organization Chart | Create Organizational Chart ...


