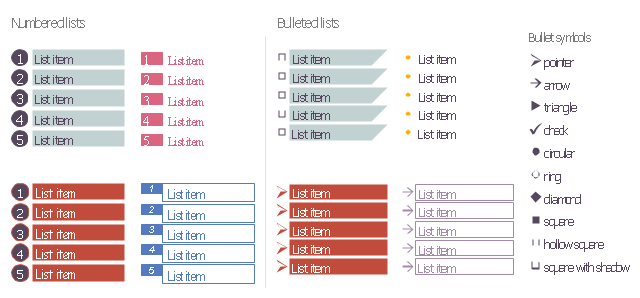
The vector stencils library "Education list blocks" contains 18 list block shapes: numbered list, bulleted list, bullets.
Use these list blocks to design your educational infograms.
"In typography, a bullet is a typographical symbol or glyph used to introduce items in a list. ...
The bullet symbol may take any of a variety of shapes, such as circular, square, diamond, arrow, etc. ...
Bullets are most often used in technical writing, reference works, notes and presentations. ...
Bulleted items – known as "bullet points" – may be short phrases, single sentences, or of paragraph length. Bulleted items are not usually terminated with a full stop if they are not complete sentences, although it is not rare to terminate every item except the last one with a semicolon, and terminate the last item with a full stop. It is correct to terminate a bullet point with a full stop if the text within that item consists of one 'full' sentence or more." [Bullet (typography). Wikipedia]
The shapes example "Design elements - Education list blocks" was created using the ConceptDraw PRO diagramming and vector drawing software extended with the Education Infographics solition from the area "Business Infographics" in ConceptDraw Solution Park.
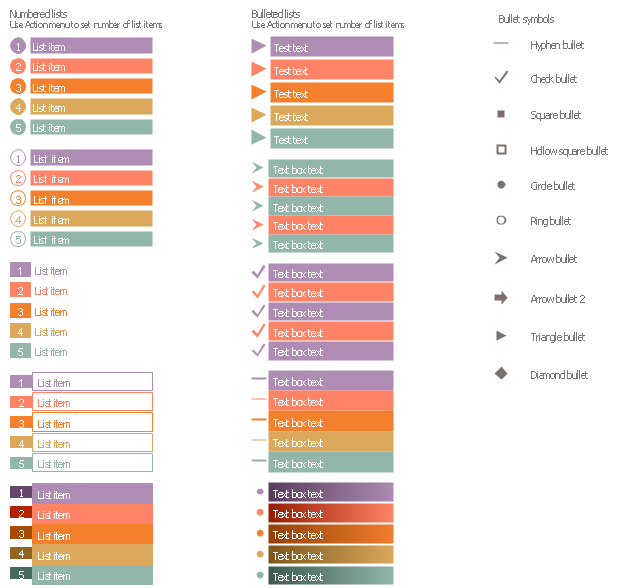
The vector stencils library "List blocks" contains 20 numbered list elements, bulleted list elements and bullet symbols for creating marketing infograms.
"In typography, a bullet ( • ) is a typographical symbol or glyph used to introduce items in a list. ...
The bullet symbol may take any of a variety of shapes, such as circular, square, diamond, arrow, etc., and typical word processor software offer a wide selection of shapes and colours. ...
Bullets are most often used in technical writing, reference works, notes and presentations." [Bullet (typography). Wikipedia]
The shapes example "Design elements - List blocks" was created using the ConceptDraw PRO diagramming and vector drawing software extended with the Marketing Infographics solition from the area "Business Infographics" in ConceptDraw Solution Park.
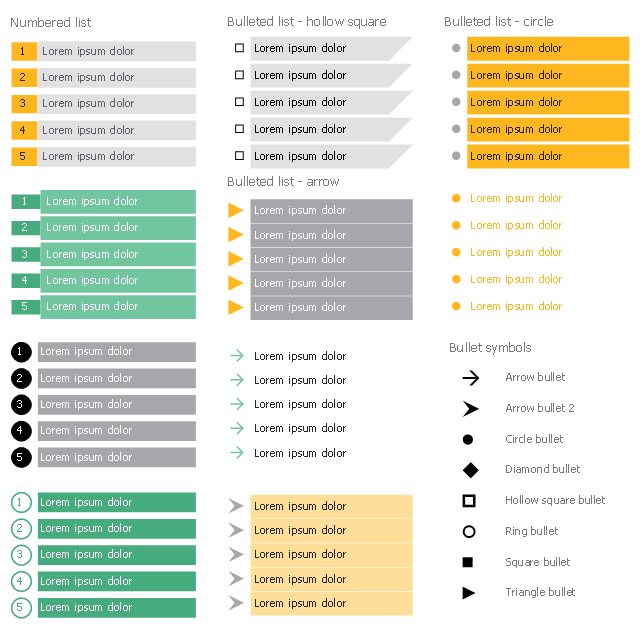
The vector stencils library "Financial lists" contains 18 list elements, including bulleted and numbered lists.
"In typography, a bullet is a typographical symbol or glyph used to introduce items in a list. ...
The bullet symbol may take any of a variety of shapes, such as circular, square, diamond or arrow." [Bullet (typography). Wikipedia]
Use it to design your financial infographics.
"In typography, a bullet is a typographical symbol or glyph used to introduce items in a list. ...
The bullet symbol may take any of a variety of shapes, such as circular, square, diamond or arrow." [Bullet (typography). Wikipedia]
Use it to design your financial infographics.
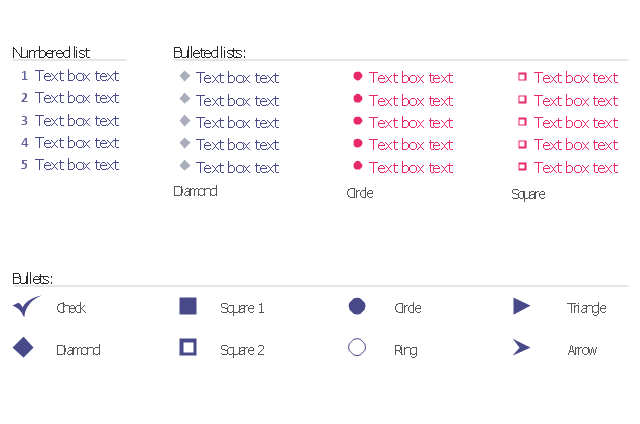
The vector stencils library "Bulleted and numbered lists" contains 12 elements of bulleted and numbered lists, and bullets for creating typography infographics.
"In typography, a bullet ( • ) is a typographical symbol or glyph used to introduce items in a list. ... The bullet symbol may take any of a variety of shapes, such as circular, square, diamond, arrow, etc., and typical word processor software offer a wide selection of shapes and colours. Several regular symbols are conventionally used in ASCII-only text or another environments where bullet characters are not available, such as * (asterisk), - (hyphen), . (period), and even o (lowercase O). Of course, when writing by hand, bullets may be drawn in any style. Historically, the index symbol was popular for similar uses." [Bullet (typography). Wikipedia]
The example "Design elements - Bulleted and numbered lists" was created using the ConceptDraw PRO diagramming and vector drawing software extended with the Typography Infographics solition from the area "What is infographics" in ConceptDraw Solution Park.
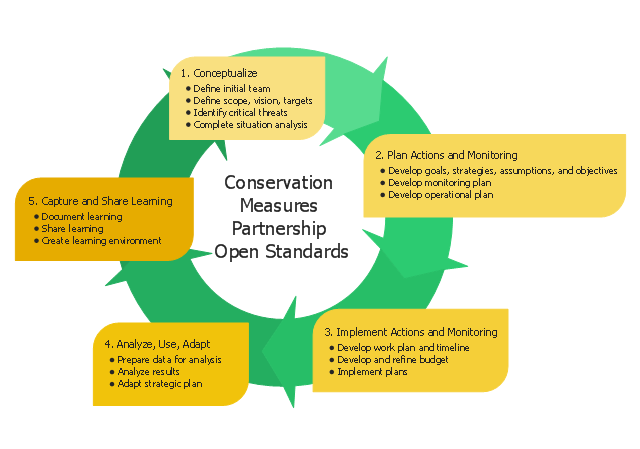
This circular arrows diagram sample shows five steps of the Conservation Measures Partnership (CMP) adaptive management cycle. It was designed on the base of the Wikimedia Commons file: CMP Cycle - 2008-02-20.jpg.
[commons.wikimedia.org/ wiki/ File:CMP_ Cycle_ -_ 2008-02-20.jpg]
"Adaptive management (AM), also known as adaptive resource management (ARM), is a structured, iterative process of robust decision making in the face of uncertainty, with an aim to reducing uncertainty over time via system monitoring. In this way, decision making simultaneously meets one or more resource management objectives and, either passively or actively, accrues information needed to improve future management. Adaptive management is a tool which should be used not only to change a system, but also to learn about the system. Because adaptive management is based on a learning process, it improves long-run management outcomes. The challenge in using the adaptive management approach lies in finding the correct balance between gaining knowledge to improve management in the future and achieving the best short-term outcome based on current knowledge.
Application to environmental projects and programs.
Open Standards for the Practice of Conservation lay out 5 main steps to an adaptive management project cycle." [Adaptive management. Wikipedia]
The diagram example "CMP adaptive management cycle" was created using the ConceptDraw PRO diagramming and vector drawing software extended with the Circular Arrows Diagrams solution from the area "What is a Diagram" of ConceptDraw Solution Park.
Used Solutions
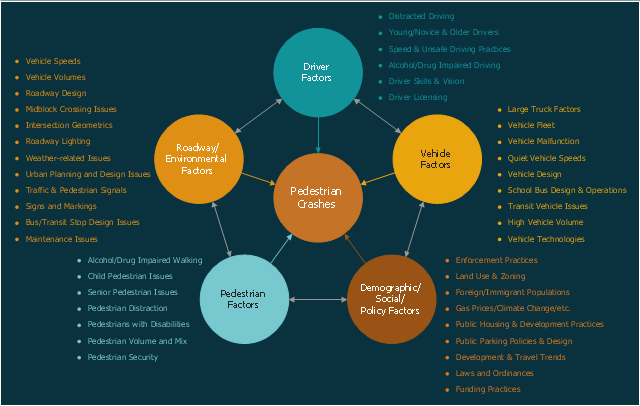
This circle-spoke diagram sample shows the factors related to pedestrian safety and morbidity. It was designed on the base of the figure 3 on the webpage "Pedestrian Safety Strategic Plan: Recommendations for Research and Product Development" from the website of the Federal Highway Administration (FHWA) of the U.S. Department of Transportation (DOT).
"Based on the data analysis and literature review, there are a wide variety of factors which contribute to the likelihood of a pedestrian crash. These include factors related to such categories as pedestrians (e.g., pedestrian age, behavior), drivers (e.g., driver distraction), vehicles (e.g., large trucks), roadway environment (e.g., vehicle speeds and volumes, roadway and intersection design), as well as demographic, social, and policy factors (e.g., land use and zoning practices). Some of the primary factors within each of these five categories are given in Figure 3."
[safety.fhwa.dot.gov/ ped_ bike/ pssp/ fhwasa10035/ ]
The hub-and-spoke diagram example "Factors related to pedestrian safety and morbidity" was created using the ConceptDraw PRO diagramming and vector drawing software extended with the Circle-Spoke Diagrams solution from the area "What is a Diagram" of ConceptDraw Solution Park.
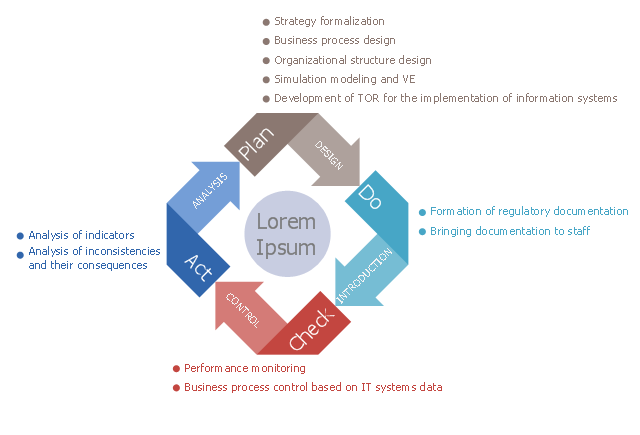
This Deming cycle sample shows plan-do-check-act diagram.
It was designed on the base of Wikimedia Commons file: Pdca.png. [commons.wikimedia.org/ wiki/ File:Pdca.png]
This file is licensed under the Creative Commons Attribution-Share Alike 3.0 Unported license. [creativecommons.org/ licenses/ by-sa/ 3.0/ deed.en]
"PDCA (and other forms of scientific problem solving) is also known as a system for developing critical thinking. At Toyota this is also known as "Building people before building cars." Toyota and other Lean companies propose that an engaged, problem-solving workforce using PDCA is better able to innovate and stay ahead of the competition through rigorous problem solving and the subsequent innovations. This also creates a culture of problem solvers using PDCA and creating a culture of critical thinkers." [PDCA. Wikipedia]
The plan-do-check-act diagram example "PDCA" was designed using ConceptDraw PRO software extended with Plan-Do-Check-Act (PDCA) solution from Management area of ConceptDraw Solution Park.
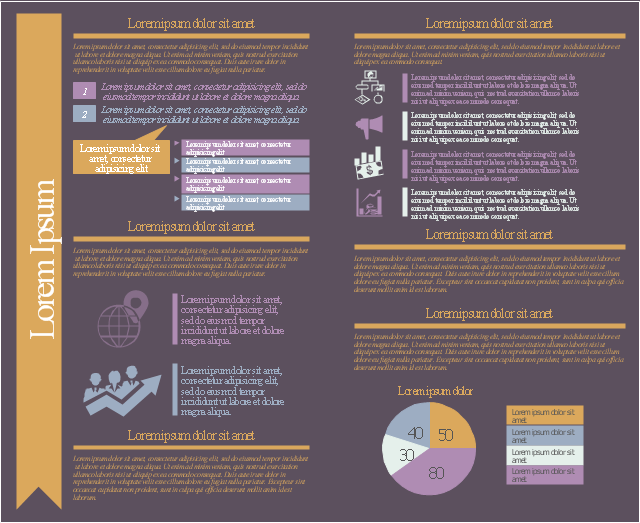
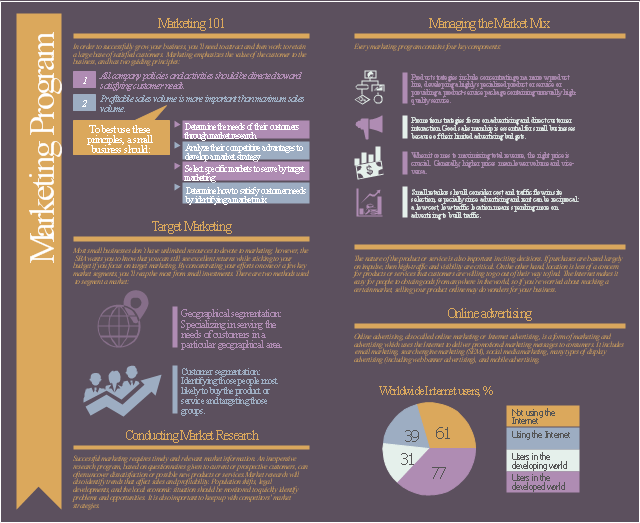
This marketing infographic template consists of design elements: title block, callout blocks, numbered and bulleted list blocks, pictograms, titled callouts, pie chart, background.
Use it to create your marketing infograms in the ConceptDraw PRO diagramming and vector drawing software.
The template "Marketing infogram 7" is included in the Marketing Infographics solution from the Business Infographics area of ConceptDraw Solution Park.
Use it to create your marketing infograms in the ConceptDraw PRO diagramming and vector drawing software.
The template "Marketing infogram 7" is included in the Marketing Infographics solution from the Business Infographics area of ConceptDraw Solution Park.
The infogram example "Marketing program" was created on the base of webpages:
(1) Marketing 101. Website of the U.S. Small Business Administration. [sba.gov/ content/ marketing-101-basics]
(2) List of countries by number of Internet users. Wikipedia.
(3) Online advertising. Wikipedia.
"A marketing program is a coordinated, thoughtfully designed set of activities that help you achieve your marketing objectives. Your marketing objectives are strategic sales goals that fit your strengths and are a good way to stretch your business in its current situation. In order to build strong customer relationships and maximize your sales, you need to put every possible marketing tool to work for you. Marketing is a broad field, encompassing elements as diverse as advertising, brand and logo design, sales calls, Web sites, brochures, packaging, shows, conferences and other events, and so on." [dummies.com/ how-to/ content/ designing-your-marketing-program.html]
The infographic example "Marketing program" was created using the ConceptDraw PRO diagramming and vector drawing software extended with the Marketing Infographics solition from the area "Business Infographics" in ConceptDraw Solution Park.
This circle-spoke diagram sample shows the factors related to pedestrian safety and morbidity. It was designed on the base of the figure 3 on the webpage "Pedestrian Safety Strategic Plan: Recommendations for Research and Product Development" from the website of the Federal Highway Administration (FHWA) of the U.S. Department of Transportation (DOT).
"Based on the data analysis and literature review, there are a wide variety of factors which contribute to the likelihood of a pedestrian crash. These include factors related to such categories as pedestrians (e.g., pedestrian age, behavior), drivers (e.g., driver distraction), vehicles (e.g., large trucks), roadway environment (e.g., vehicle speeds and volumes, roadway and intersection design), as well as demographic, social, and policy factors (e.g., land use and zoning practices). Some of the primary factors within each of these five categories are given in Figure 3."
[safety.fhwa.dot.gov/ ped_ bike/ pssp/ fhwasa10035/ ]
The hub-and-spoke diagram example "Factors related to pedestrian safety and morbidity" was created using the ConceptDraw PRO diagramming and vector drawing software extended with the Circle-Spoke Diagrams solution from the area "What is a Diagram" of ConceptDraw Solution Park.
"Based on the data analysis and literature review, there are a wide variety of factors which contribute to the likelihood of a pedestrian crash. These include factors related to such categories as pedestrians (e.g., pedestrian age, behavior), drivers (e.g., driver distraction), vehicles (e.g., large trucks), roadway environment (e.g., vehicle speeds and volumes, roadway and intersection design), as well as demographic, social, and policy factors (e.g., land use and zoning practices). Some of the primary factors within each of these five categories are given in Figure 3."
[safety.fhwa.dot.gov/ ped_ bike/ pssp/ fhwasa10035/ ]
The hub-and-spoke diagram example "Factors related to pedestrian safety and morbidity" was created using the ConceptDraw PRO diagramming and vector drawing software extended with the Circle-Spoke Diagrams solution from the area "What is a Diagram" of ConceptDraw Solution Park.
- Design elements - Education list blocks | Design elements - Bulleted ...
- Design elements - Bulleted and numbered lists | Design elements ...
- Bullet Point Png
- Bullet Point Symbol
- List Bullet Png
- Design elements - Education list blocks | Design elements - List ...
- Design Bullet List
- Data Bullet Point Png
- Design elements - Education list blocks
- Design elements - Management list blocks | Design elements - List ...
