The Data flow diagram (DFD) example "Payment for goods using UPS code scanner" shows data flow in process of payment for goods in the shop using the MaxiCode scanner.
"MaxiCode is a public domain, machine-readable symbol system originally created and used by United Parcel Service. Suitable for tracking and managing the shipment of packages, it resembles a barcode, but uses dots arranged in a hexagonal grid instead of bars. MaxiCode has been standardised under ISO/ IEC 16023.
A MaxiCode symbol (internally called "Bird's Eye", "Target", "dense code", or "UPS code") appears as a 1 inch square, with a bullseye in the middle, surrounded by a pattern of hexagonal dots. It can store about 93 characters of information, and up to 8 MaxiCode symbols can be chained together to convey more data. The centered symmetrical bullseye is useful in automatic symbol location regardless of orientation, and it allows MaxiCode symbols to be scanned even on a package traveling rapidly." [MaxiCode. Wikipedia]
This example of data flow diagram (Gane & Sarson notation) was created using the ConceptDraw PRO diagramming and vector drawing software extended with the Data Flow Diagrams solution from the Software Development area of ConceptDraw Solution Park.
Marketing - Design Elements
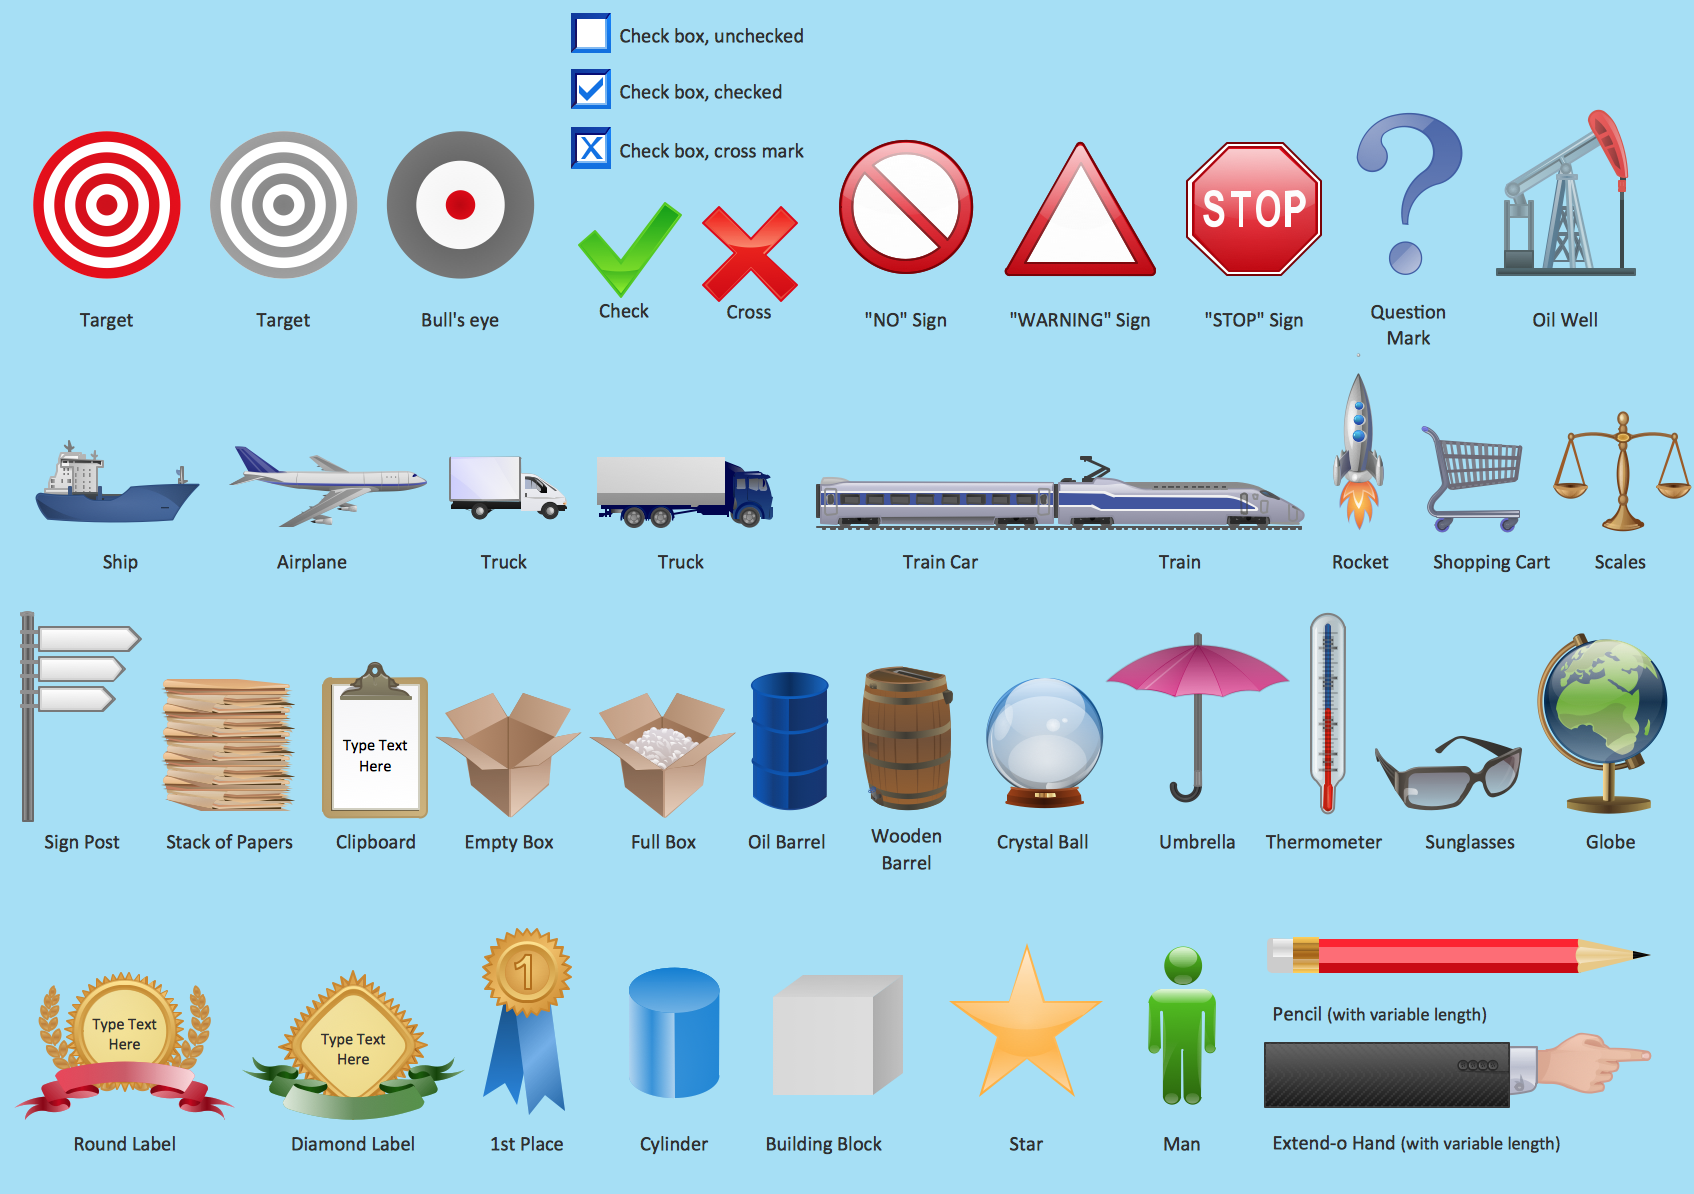
If you need to pull together a quick marketing drawing, you'll find elements, samples, templates and libraries with vector clip art for drawing the Marketing Illustrations. These symbols and signs you can use in your design for Strategic Marketing, Graphic Design, Inbound and Content Marketing, Social Media, Lead Generation, Email Marketing and Automation, CRM implementation and Integration and more. This symbols used for marketing presentation, project management report, project management tracking tools and other types of creative project management software.The vector stencils library "Marketing" contains 30 marketing icons.
Use it to design your business and finance illustrations and infographics with ConceptDraw PRO diagramming and vector drawing software.
The vector stencils library "Marketing" is included in the Business and Finance solution from the Illustration area of ConceptDraw Solution Park.
Use it to design your business and finance illustrations and infographics with ConceptDraw PRO diagramming and vector drawing software.
The vector stencils library "Marketing" is included in the Business and Finance solution from the Illustration area of ConceptDraw Solution Park.
- Marketing Diagrams | Marketing | Six Markets Model Chart | Marketing
- Circle-spoke diagram - Target market | Target Diagram | Circle ...
- Circle-spoke diagram - Target market | Target diagrams - Vector ...
- Target Diagram | Target and Circular Diagrams | Daily Schedule ...
- Circle-spoke diagram - Target market | Target and Circular ...
- Pyramid Chart Examples | Target and Circular Diagrams | Bar ...
- With The Aid Of Diagram Describe Psychoanalysis Of A Target Buyer
- Target Diagram | ConceptDraw Solution Park | UML Diagram Editor ...
- Market Chart | Target diagrams - Vector stencils library ...
- Diagram Of Target Buyer
- Train Draw Bull Diagrams
- Marketing - Vector stencils library | Marketing Plan Infographic ...
- Entity-Relationship Diagram (ERD) | Block Diagrams | Sales ...
- Sales Process Flowchart. Flowchart Examples | Block Diagrams ...
- Plant Layout Plans | Aerospace and Transport | Entity Relationship ...
- Block diagram - Branding strategies | Bar Diagrams for Problem ...
- Block diagram - Types of individual behavior in organization ...
- How to Build Cloud Computing Diagram Principal Cloud ...
- Block Diagrams | How to Draw a Block Diagram in ConceptDraw ...
- Examples Of Marketing Concept
---payment-for-goods-using-ups-code-scanner.png--diagram-flowchart-example.png)


