Multi Layer Venn Diagram. Venn Diagram Example
To visualize the relationships between subsets of the universal set you can use Venn diagrams. To construct one, you should divide the plane into a number of cells using n figures. Each figure in the chart represents a single set of, and n is the number of represented sets. Splitting is done in a way that there is one and only one cell for any set of these figures, the points of which belong to all the figures from the set and do not belong to others. The plane on which the figures are represented, is the universal set U. Thus, the point which does not belong to any of the figures, belongs only to U.Venn Diagrams
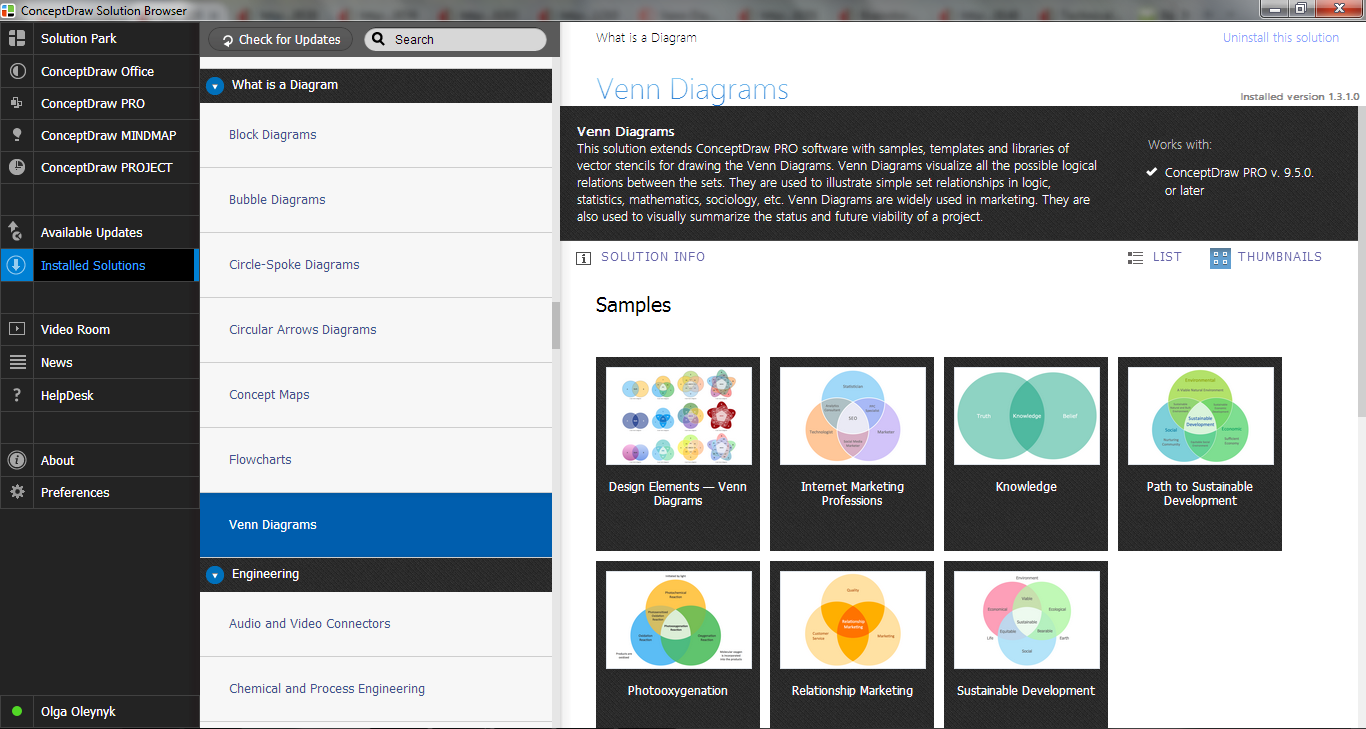
Venn Diagrams are actively used to illustrate simple set relationships in set theory and probability theory, logic and statistics, mathematics and computer science, linguistics, sociology, and marketing. Venn Diagrams are also often used to visually summarize the status and future viability of a project.
Venn Diagram Examples
ConceptDraw DIAGRAM diagramming and vector drawing software extended with Venn Diagrams solution from "Diagrams" area offers a wide set of professionally designed Venn Diagram examples which can become the good start and beautiful source of inspiration for your own Venn Diagrams.Venn Diagram Template for Word
This template shows the Venn Diagram. It was created in ConceptDraw DIAGRAM diagramming and vector drawing software using the ready-to-use objects from the Venn Diagrams Solution from the "Diagrams" area of ConceptDraw Solution Park.Venn Diagram Examples for Problem Solving. Venn Diagram as a Truth Table
Venn diagrams are illustrations used in the branch of mathematics known as set theory. They show the mathematical or logical relationship between different groups of things (sets). A Venn diagram shows all the possible logical relations between the sets.Business diagrams & Org Charts with ConceptDraw DIAGRAM
Business flowcharting tool helps you create a flowchart with minimal effort. With ConceptDraw you can make a flowchart, draw data flow diagrams, orgchart professional, process flow diagrams etc - without any prior knowledge or training.Basic Circles Venn Diagram. Venn Diagram Example
Venn Diagrams visualize all possible logical relations between several sets and are widely used in mathematics, logic, statistics, marketing, sociology, etc.This Venn Diagram shows the relative complement of the set A with respect to the set B. It is the set of the elements in B, but not in A. In other words it is the set-theoretic difference B-A.
Venn Diagram Examples for Problem Solving. Environmental Social Science. Human Sustainability Confluence
The Venn diagram example below shows sustainable development at the confluence of three constituent parts.Create your Venn diagrams for problem solving in environmental social science using the ConceptDraw DIAGRAM diagramming and vector drawing software extended with the Venn Diagrams solution from the area "Diagrams" of ConceptDraw Solution Park.
3 Circle Venn. Venn Diagram Example
This example shows the 3 Circle Venn Diagram. The Venn Diagrams visualize all possible logical intersections between several sets. On this example you can see the intersections of 3 sets. Venn Diagrams are widely used in mathematics, logic, statistics, marketing, sociology, etc.Basic Venn Diagrams
This solution extends ConceptDraw DIAGRAM (or later) with samples, templates, and libraries of vector stencils for drawing Venn Diagrams.
- Accounting Flowcharts | Venn Diagrams | Business diagrams & Org ...
- The Venn Diagram Of The Three Business Environment Micro ...
- Venn Diagram Examples for Problem Solving. Environmental Social ...
- Social Ecological Model (SEM) - Onion diagram | Business Process ...
- Venn Diagram Examples for Problem Solving. Computer Science ...
- Business process Flow Chart - Event-Driven Process chain (EPC ...
- Business Process Mapping | Fishbone Diagrams | Venn Diagrams ...
- Venn Diagram Maker | Venn Diagram Examples | Business Package ...
- Venn Diagrams | School and Training Plans | Business Process ...
- Venn Diagrams | Computer Network Diagrams | Business Package ...
- ERD | Entity Relationship Diagrams, ERD Software for Mac and Win
- Flowchart | Basic Flowchart Symbols and Meaning
- Flowchart | Flowchart Design - Symbols, Shapes, Stencils and Icons
- Flowchart | Flow Chart Symbols
- Electrical | Electrical Drawing - Wiring and Circuits Schematics
- Flowchart | Common Flowchart Symbols