 Marketing
This solution extends ConceptDraw PRO v9 and ConceptDraw MINDMAP v7 with Marketing Diagrams and Mind Maps (brainstorming, preparing and holding meetings and presentations, sales calls).
How to create a UML Diagram
ConceptDraw PRO extended with the Rapid UML solution is perfect for drawing professional UML diagrams.Quality Improvement
Constant improvement of key performance indicators that are related to quality is a step in the right direction for a company interested in market growth.UML Deployment Diagram. Design Elements
UML Deployment diagram describes the hardware used in system implementations and the execution environments and artifacts deployed on the hardware.ConceptDraw has 393 vector stencils in the 13 libraries that helps you to start using software for designing your own UML Diagrams. You can use the appropriate stencils of UML notation from UML Deployment library.
 Matrices
This solution extends ConceptDraw PRO software with samples, templates and library of design elements for drawing the business matrix diagrams.
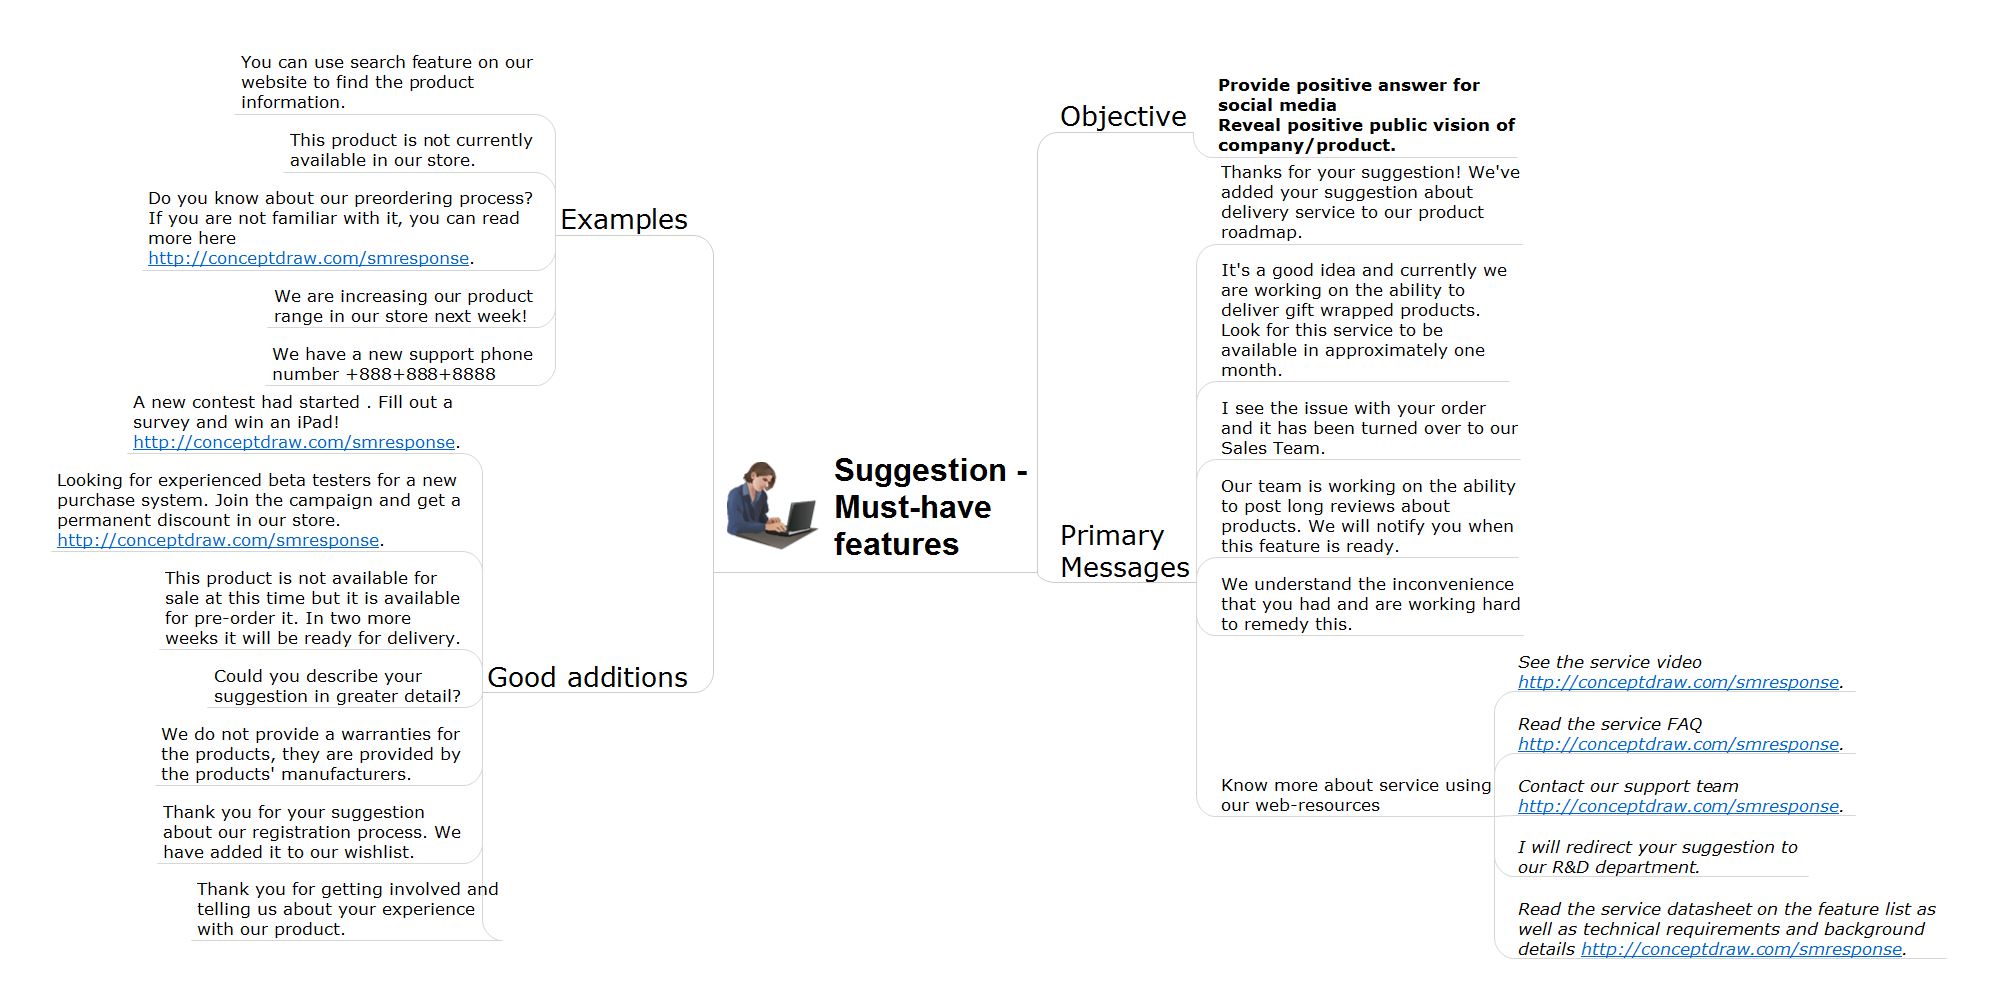
How to Present Workflow to Team
To pull a social media team together, to set your objectives, to develope an integrated communications strategy.
 Line Graphs
How to draw a Line Graph with ease? The Line Graphs solution extends the capabilities of ConceptDraw PRO v10 with professionally designed templates, samples, and a library of vector stencils for drawing perfect Line Graphs.
Chart Templates
Easy charting software comes with beautiful chart templates and examples. This makes it easy to create professional charts without prior experience.Software Defined Networking System Overview
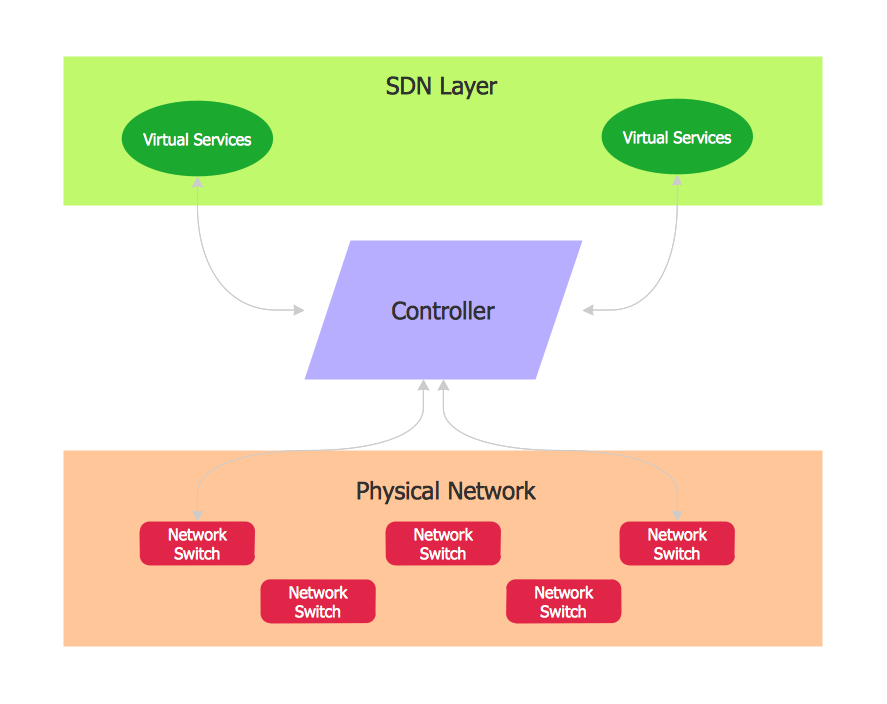
Software-Defined Networking (SDN) is a new powerful concept for decision these problems. SDN proposes to disaggregate the traditional networking stacks that are vertically integrated to customize the network operations for specialized environments and improve network service velocity.On this example you can see the Software-Defined Networking (SDN) diagram that was created in ConceptDraw PRO using the Computer and Networks Area of ConceptDraw Solution Park.

 Picture Graphs
Typically, a Picture Graph has very broad usage. They many times used successfully in marketing, management, and manufacturing. The Picture Graphs Solution extends the capabilities of ConceptDraw PRO v10 with templates, samples, and a library of professionally developed vector stencils for designing Picture Graphs.
 Football
The Football Solution extends ConceptDraw PRO v9.5 (or later) software with samples, templates, and libraries of vector objects for drawing football (American) diagrams, plays schemas, and illustrations. It can be used to make professional looking documen
 Frequency Distribution Dashboard
Frequency distribution dashboard solution extends ConceptDraw PRO software with samples, templates and vector stencils libraries with histograms and area charts for drawing the visual dashboards showing frequency distribution of data.
 PM Dashboards
This solution extends ConceptDraw PRO and ConceptDraw PROJECT software with the ability to clearly display the identified key performance indicators for any project.
 Area Charts
Area Charts are used to display the cumulative totals over time using numbers or percentages; or to show trends over time among related attributes. The Area Chart is effective when comparing two or more quantities. Each series of data is typically represented with a different color, the use of color transparency in an object’s transparency shows overlapped areas and smaller areas hidden behind larger areas.
- Business Tools Perceptual Mapping | Growth -Share Matrix Software ...
- Sales Growth . Bar Graphs Example | Bar Chart Examples | Business ...
- Sales Growth . Bar Graphs Example | Event-driven Process Chain ...
- Sales Growth . Bar Graphs Example | Bar Diagrams for Problem ...
- Positioning map | Competitor Analysis | Business Tools Perceptual ...
- Business and Finance | Financial Trade UML Use Case Diagram ...
- How to Make an Ansoff Matrix Template in ConceptDraw PRO | New ...
- How to create a UML Diagram
- Business Process Management | How to Create Management ...
- How To Create an Involvement Matrix | SWOT Matrix Template ...
- Business Models | Business model diagram | Business model ...
- Examples of Flowcharts, Org Charts and More | Business Diagram ...
- Sales Growth . Bar Graphs Example | Line Chart Examples | Create ...
- Create Graphs and Charts | Bar Diagrams for Problem Solving ...
- Sales Growth . Bar Graphs Example
- UML Component Diagram Example - Online Shopping | State ...
- How can you illustrate the weather condition | Affinity diagram ...
- UML interaction overview diagram - Online shopping | Online ...
- Process Flowchart | Total Quality Management Value | Top iPad ...
- SWOT Analysis Solution - Strategy Tools | Process Flowchart ...


