This site uses cookies. By continuing to browse the ConceptDraw site you are agreeing to our Use of Site Cookies.

bi dashboard, business intelligence solutions, dynamic chart, bi chart Business Intelligence Dashboard

bi dashboard, business intelligence solutions, dynamic chart, bi chart
Business Intelligence Dashboard solution extends the ConceptDraw DIAGRAM functionality with exclusive tools, numerous ready-to-use vector objects, samples and quick-start templates for creation professional Business Intelligence Dashboards, Business Intelligence Graphics, Business Intelligence Charts and Maps of different kinds. Design easy the BI dashboard, BI model or Dynamic chart in ConceptDraw DIAGRAM to monitor the company's work, to track the indicators corresponding your company's data, to display and analyze key performance indicators, to evaluate the trends and regularities of the processes occurring at the company.

Business Intelligence Dashboard Software

ConceptDraw DIAGRAM is a business intelligence dashboard software that allows you produce sales dashboard that suites your specific needs. To see how your business can improve with sales dashboards select KPI and start tracking it.
"Location Intelligence is the capacity to organize and understand complex phenomena through the use of geographic relationships inherent in all information. By combining geographic- and location-related data with other business data, organizations can gain critical insights, make better decisions and optimize important processes and applications. Location Intelligence offers organizations opportunities to streamline their business processes and customer relationships to improve performance and results.
Location Intelligence tools leverage a variety of data sources including aerial maps, geographic information systems (GIS), consumer demographics as well as a user’s own customer records. ...
Location Intelligence is also used to describe the integration of a geographical component into Business Intelligence processes and tools, often incorporating Spatial Database and spatial OLAP tools." [Location intelligence. Wikipedia]
The location intelligence dashboard example "New European Customers" was created using the ConceptDraw PRO diagramming and vector drawing software extended with the Spatial Dashboard solution from the area "What is a Dashboard" of ConceptDraw Solution Park.
Location intelligence dashboard
Location intelligence dashboard, Europe,

project management, scrum, agile, business Project Management Package

project management, scrum, agile, business
Project Management Package includes a large set of graphical solutions from the ConceptDraw Solution Park. They are selected specially to help in completing the business and management goals, creating business models and modeling business processes, analyzing business progress and efficiency of projects implementation. The tools of this package's solutions are helpful to create number of diagrams and dashboards including Management Diagrams, Business diagrams, Bubble diagrams, Circle-spoke diagrams, Circular arrows diagrams, Venn diagrams, Scrum charts, Kanban boards, Business Intelligence maps, Business Metric charts, Dynamic charts, Project diagrams, Hierarchical charts, Influence diagrams, Work Breakdown Structures (WBS), Resource Breakdown Structures (RBS), PERT Diagrams, Project management charts, Project timelines, Gantt Charts, Funnel diagrams, Stakeholder Onion diagrams, and many more.
This business intelligence dashboard sample shows the year-to-date top 10 products sales by regions using horizontal bar charts.
"Dashboards often provide at-a-glance views of KPIs (key performance indicators) relevant to a particular objective or business process (e.g. sales, marketing, human resources, or production). In real-world terms, "dashboard" is another name for "progress report" or "report."" [Dashboard (business). Wikipedia]
The BI dashboard example "Year-to-date Top 10 Products Sales by Regions" was created using ConceptDraw PRO software extended with the Business Intelligence Dashboards solution from the Business Processes area of ConceptDraw Solution Park.
North America
North America, radio buttons, radio button, horizontal bar chart, checkbox,
Europe
Europe, radio buttons, radio button, horizontal bar chart, checkbox,
Asia
Asia, radio buttons, radio button, horizontal bar chart, checkbox,
South America
South America, radio buttons, radio button, horizontal bar chart, checkbox,
Pacific
Pacific, radio buttons, radio button, horizontal bar chart, checkbox,
Africa
Africa, radio buttons, radio button, horizontal bar chart, checkbox,
The vector stencils library "BI charts" contains 10 graph templates.
Use it to visualize business metrics on your business intelligence dashboards in ConceptDraw PRO software.
"A chart can take a large variety of forms, however there are common features that provide the chart with its ability to extract meaning from data.
Typically the data in a chart is represented graphically, since humans are generally able to infer meaning from pictures quicker than from text. Text is generally used only to annotate the data." [Chart. Wikipedia]
The graph and chart templates example "Design elements - BI charts" is included in the Business Intelligence Dashboards solution from the Business Processes area of ConceptDraw Solution Park.
Graphs and charts
Graphs and charts, vertical bar chart, column chart, serial line chart, line graph, scatter plot, XY chart, pie chart, horizontal bar chart, histogram, dot plot, scatter plot, donut chart, ring chart, divided bar chart, checkbox, area chart,
This business intelligence dashboard sample shows the top 10 products sales by stores in September, 2016 using vertical bar charts.
"Bar graphs/ charts provide a visual presentation of categorical data. Categorical data is a grouping of data into discrete groups, such as months of the year, age group, shoe sizes, and animals. These categories are usually qualitative. In a column bar chart, the categories appear along the horizontal axis; the height of the bar corresponds to the value of each category." [Bar chart. Wikipedia]
The BI dashboard example "Top 10 Products Sales by Stores, September 2016" was created using ConceptDraw PRO software extended with the Business Intelligence Dashboards solution from the Business Processes area of ConceptDraw Solution Park.
Store 1
Store 1, vertical bar chart, column chart, radio buttons, radio button, checkbox,
Store 2
Store 2, vertical bar chart, column chart, radio buttons, radio button, checkbox,
Store 3
Store 3, vertical bar chart, column chart, radio buttons, radio button, checkbox,
Store 4
Store 4, vertical bar chart, column chart, radio buttons, radio button, checkbox,
Store 5
Store 5, vertical bar chart, column chart, radio buttons, radio button, checkbox,

Business Management Package

Business Management Package is a large set of graphical solutions from the ConceptDraw Solution Park. They are selected to help in solving the business, management, marketing and quality tasks in a best way. It is useful for many management specialists, marketing experts, business specialists, international business experts, IT managers, specialists in managing the business processes, financial specialists, and other business related specialists. Create documents, reports, statistical summaries, describe business processes, build business models for many fields including finance, education, logistic, landscape design, health, cooking, and many more.

Dashboard

ConceptDraw DIAGRAM extended with Sales Dashboard solution from the Marketing area of ConceptDraw Solution Park is a perfect software for creating the live dashboard for the business data and progress visualization.

ducation infographics and infograms, Business intelligence dashboards, Business intelligence charts and maps, Bubble diagrams and charts, Spray diagrams, Circle-Spoke diagrams and models, Circle diagrams, Circular arrows diagrams, Circular flow diagrams, Education Package

ducation infographics and infograms, Business intelligence dashboards, Business intelligence charts and maps, Bubble diagrams and charts, Spray diagrams, Circle-Spoke diagrams and models, Circle diagrams, Circular arrows diagrams, Circular flow diagrams,
Education Package is a comprehensive set of multifarious graphical solutions from ConceptDraw Solution Park, collected together in help to ConceptDraw DIAGRAM users working in a field of science, education and training, which is aimed at improving the quality of education and helping to design with ease variety of interesting and colorful educational materials, diagrams, charts and maps. Use it to present the information and knowledge in an interesting, clear, structured and simple form to achieve a success in education and pedagogy, to maintain the interest of students and pupils throughout the whole learning process, at the lectures, lessons and even during independent work with additional materials, to contribute to better perception of scientific information by listeners during the conferences and reports.
"Spatial Intelligence is the use of geographic information by retailers and other businesses to understand and market to their customers. It is often associated with real estate and retail development.
In market research vernacular, spatial intelligence results from using data gleaned from a variety of population and demographic data sources." [Spatial intelligence (business method). Wikipedia]
The spatial intelligence dashboard example "New European Customers" was created using the ConceptDraw PRO diagramming and vector drawing software extended with the Spatial Dashboard solution from the area "What is a Dashboard" of ConceptDraw Solution Park.
Spatial intelligence dashboard
Spatial intelligence dashboard, Europe,
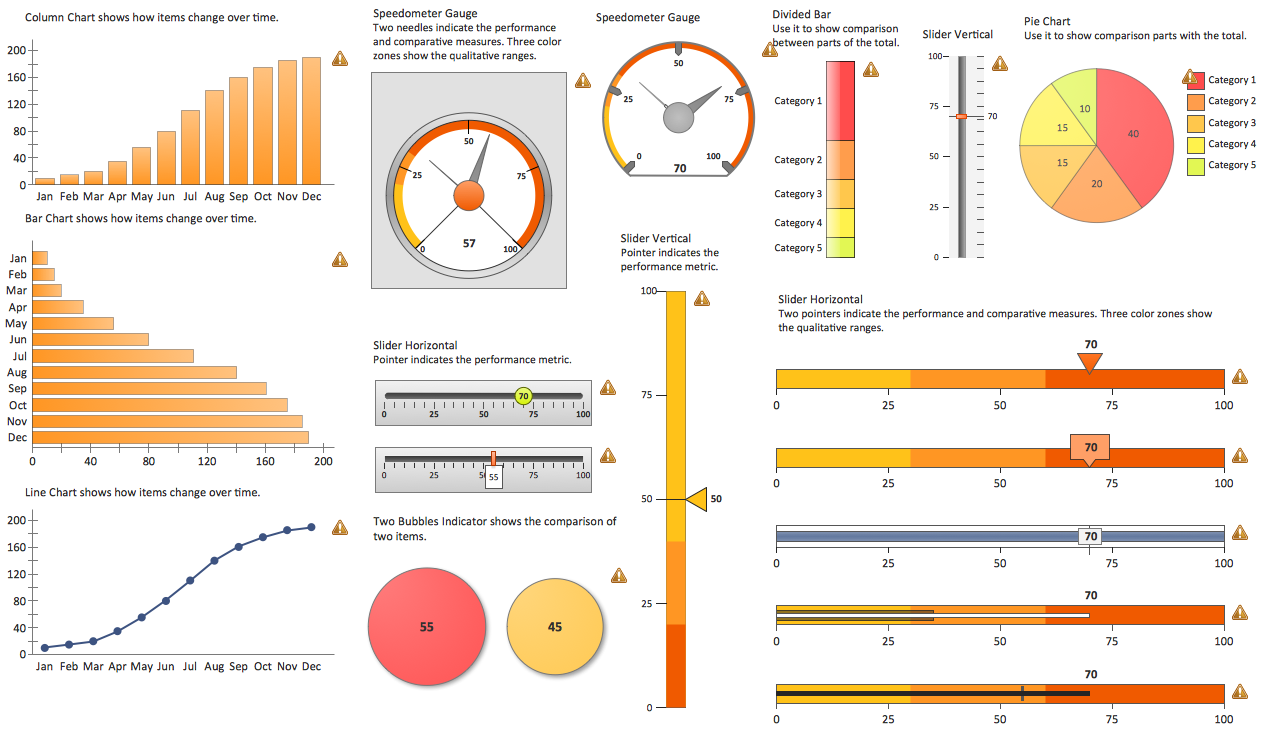
The example "Sale dashboard" displays the KPIs and sales effectiveness metrics visual indicators: speedometer gauge, dial, slider, level meter and bullet indicators.
"Sales intelligence (SI) refers to technologies, applications and practices for the collection, integration, analysis, and presentation of information to help salespeople keep up to date with clients, prospect data and drive business. In addition to providing metrics for win-loss and sales confidence, SI can present contextually relevant customer and product information. ...
Top performing companies have implemented sales intelligence programs to improve the quality and quantity of sales leads. SI contextualizes opportunities by providing relevant industry, corporate and personal information. Frequently SI's fact-based information is integrated or includes Customer Relationship Management (CRM).
Although some aspects of sales intelligence overlaps business intelligence (BI), SI is specifically designed for the use of salespeople and sales managers. Unlike customer relationship management (CRM) and traditional business intelligence (BI) applications, SI provides real-time analysis of current sales data and assists with suggesting and delivering actionable, relevant information." [Sales intelligence. Wikipedia]
The example "Sale dashboard" was created using the ConceptDraw PRO diagramming and vector drawing software extended with the Meter Dashboard solution from the area "What is a Dashboard" of ConceptDraw Solution Park.
Sales dashboard
Sales dashboard, speedometer, gauge, slider, level meter, dial, bullet,

Data Visualization Solutions

Data visualization solutions help you to see how your business can improve. Visualizing sales data using ConceptDraw Sales Dashboard gives you a bird's-eye view of the sale process.

spatial dashboard, spatial information visualization Spatial Dashboard

spatial dashboard, spatial information visualization
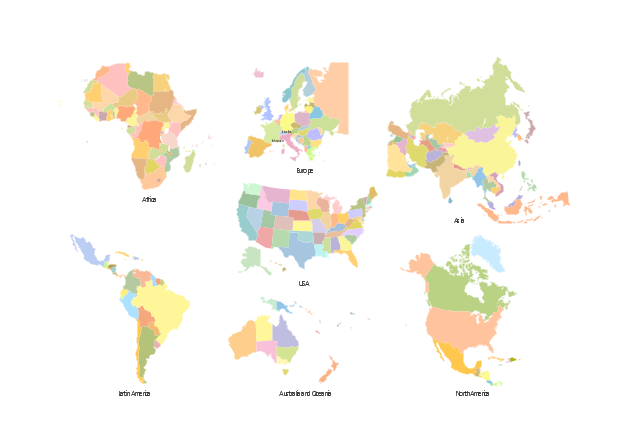
The Spatial Dashboard solution extends ConceptDraw DIAGRAM software with templates, samples and vector stencils libraries with thematic maps for drawing visual dashboards showing spatial data. It also allows saving time and creating a dashboard simpler and quicker rather than to run a few different reports. The Spatial Dashboard solution is the one that helps to visualize the spatial info on Thematic Maps, showing the way some particular metric varies across territories.

Dashboard Software

ConceptDraw PRo is a software that is perfect for creating dynamic dashboards for visualizing sales data. You can match your KPI to pre-designed visual indicators and start tracking your sales performance in real-time.

MS Visio Look a Like Diagrams

No need for any special drawing skills to create professional looking diagrams outside of your knowledge base. ConceptDraw DIAGRAM takes care of the technical details, allowing you to focus on your job, not the drawing. ConceptDraw DIAGRAM delivers full-functioned alternative to MS Visio. ConceptDraw DIAGRAM supports import of Visio files. ConceptDraw DIAGRAM supports flowcharting, swimlane, orgchart, project chart, mind map, decision tree, cause and effect, charts and graphs, and many other diagram types.

Reporting Dashboard Software for Business

An effective way to improve your business is using reporting dashboard software. ConceptDraw DIAGRAM software extended with the Sales Dashboard solution helps you monitor all KPI on the one screen in real time.

Sales Dashboard - Access Anywhere

ConceptDraw Sales Dashboard is an automatically updated sales dashboard you can customize to see KPI you need. You can access sales dashboard anywhere to get fresh data and use any minute to see how your business can improve.