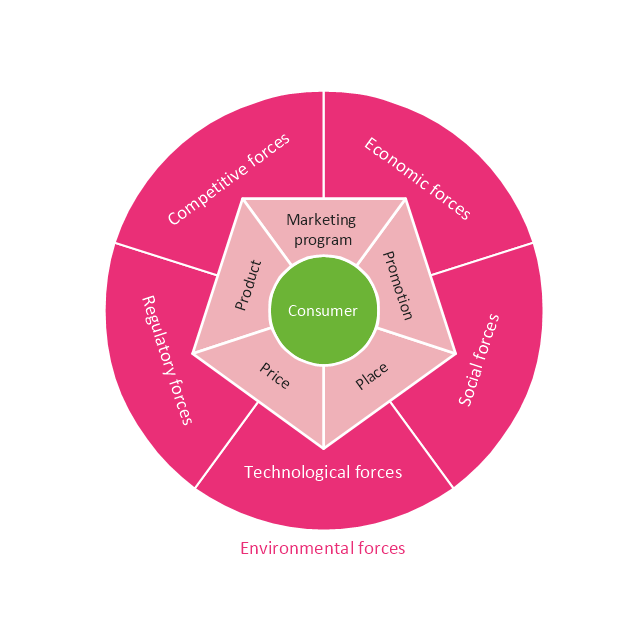
This circular diagram sample was created on the base of the figure from the Florence-Darlington Technical College website. [bus.fdtc.edu/ sbed/ core/ core7.html]
"A marketing plan may be part of an overall business plan. Solid marketing strategy is the foundation of a well-written marketing plan. While a marketing plan contains a list of actions, a marketing plan without a sound strategic foundation is of little use. ...
A marketing plan for a small business typically includes Small Business Administration Description of competitors, including the level of demand for the product or service and the strengths and weaknesses of competitors:
(1) Description of the product or service, including special features.
(2) Marketing budget, including the advertising and promotional plan.
(3) Description of the business location, including advantages and disadvantages for marketing.
(4) Pricing strategy.
(5) Market Segmentation." [Marketing plan. Wikipedia]
The circular diagram example "Marketing plan" was created using the ConceptDraw PRO diagramming and vector drawing software extended with the Target and Circular Diagrams solution from the Marketing area of ConceptDraw Solution Park.
www.conceptdraw.com/ solution-park/ marketing-target-and-circular-diagrams
 ConceptDraw Solution Park
ConceptDraw Solution Park collects graphic extensions, examples and learning materials
 Marketing Diagrams
Marketing Diagrams solution extends ConceptDraw DIAGRAM diagramming software with abundance of samples, templates and vector design elements intended for easy graphical visualization and drawing different types of Marketing diagrams and graphs, including Branding Strategies Diagram, Five Forces Model Diagram, Decision Tree Diagram, Puzzle Diagram, Step Diagram, Process Chart, Strategy Map, Funnel Diagram, Value Chain Diagram, Ladder of Customer Loyalty Diagram, Leaky Bucket Diagram, Promotional Mix Diagram, Service-Goods Continuum Diagram, Six Markets Model Diagram, Sources of Customer Satisfaction Diagram, etc. Analyze effectively the marketing activity of your company and apply the optimal marketing methods with ConceptDraw DIAGRAM software.
Pyramid Chart Examples
Pyramid Charts and Triangle Diagrams are used to visually structure the topics and progressively order the quantitative data. They allow to illustrate hierarchical structure of the topics, proportional, interconnected and containment relations among the topics. The multilevel Pyramids and Triangle diagrams are constructed oriented up or down and divided into several horizontal slices. They are effectively used to represent marketing strategies, social strategies, information systems, market value, etc., to illustrate presentations, websites, documents, reports in business, finances, sales, management, marketing, media, training, consulting, and many other fields. To maximize the efficiency in drawing the Pyramid Charts, use the ConceptDraw DIAGRAM diagramming and vector drawing software extended with Pyramid Diagrams solution from Marketing area, which contains the set of Pyramid Chart examples, samples, templates and vector design elements of triangular diagrams and pyramids with different quantity of levels for various needs.
 Pyramid Diagrams
Pyramid Diagrams solution extends ConceptDraw DIAGRAM software with templates, samples and library of vector stencils for drawing the marketing pyramid diagrams.
Marketing Plan Infographic
You need design the Marketing Plan Infographic and dream to find the useful tools to draw it easier, quickly and effectively? ConceptDraw DIAGRAM offers the unique Marketing Infographics Solution from the Business Infographics Area that will help you!
 Target and Circular Diagrams
This solution extends ConceptDraw DIAGRAM software with samples, templates and library of design elements for drawing the Target and Circular Diagrams.
Marketing Analysis Diagram
An example of marketing analysis diagram, can be used to analyse product market and define marketing strategy. This types of charts used by small business project management for making presentations on market shares, it used by marketing project management software and project management tracking tools for reporting results and statuses.HVAC Marketing Plan
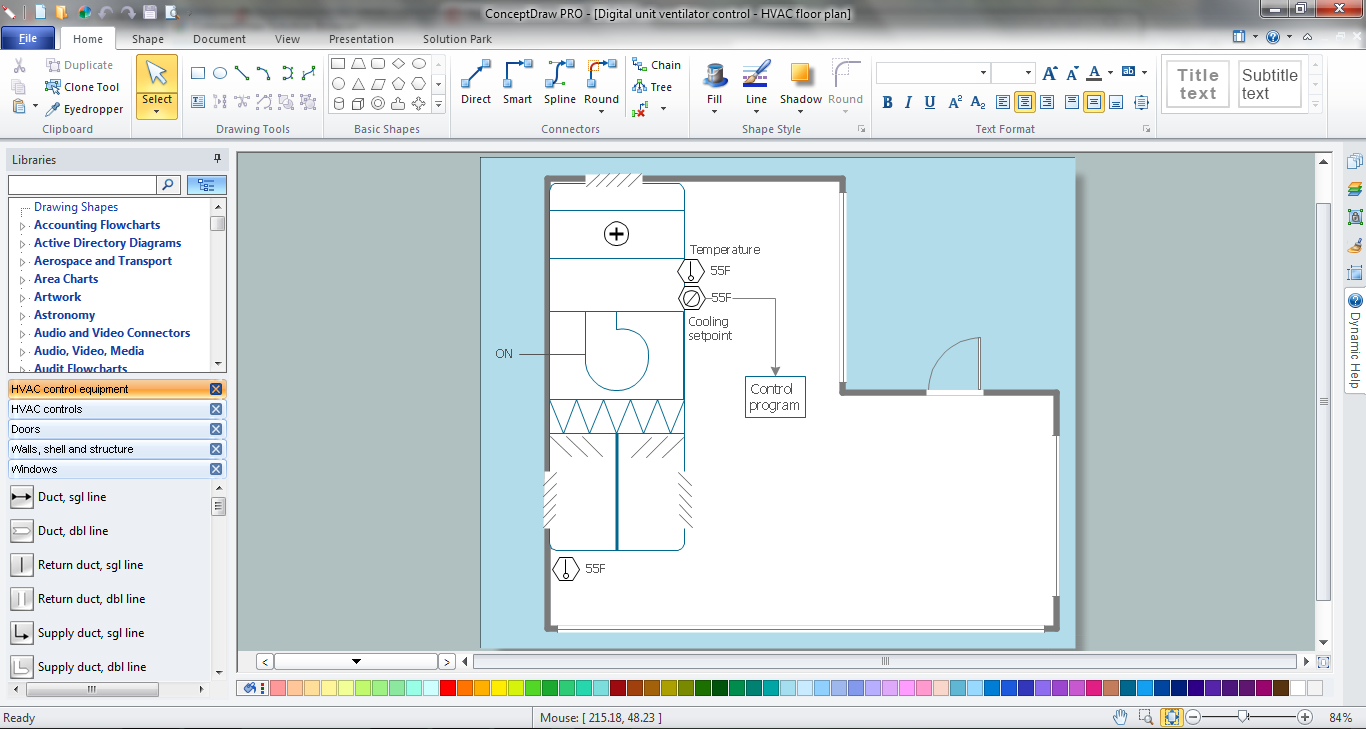
Usually for drawing HVAC plans you need make a lot of efforts and spend a considerable amount of time. ConceptDraw DIAGRAM software will help you radically change this. HVAC Marketing Plan design without efforts? It is reality with HVAC Plans Solution from the Building Plans Area of ConceptDraw DIAGRAM Solution Park.
 Matrices
This solution extends ConceptDraw DIAGRAM software with samples, templates and library of design elements for drawing the business matrix diagrams.
SWOT Sample in Computers
SWOT analysis is an effective method of making the plan for evaluation the Strengths, Weaknesses, Opportunities, and Threats that are involved in a project. It is actively applied in business sphere and helps define the objective of the project. It lets detect and represent the external and internal causes for the accomplishing the project goals and business purposes, and also plays important role in formation successful and perspective business. ConceptDraw DIAGRAM is a perfect diagramming software which nicely suits for SWOT analysis and representation its results in the form of SWOT diagrams of different complexity and design, thanks to the included SWOT and TOWS Matrix Diagrams solution from Management area of ConceptDraw Solution Park. This solution contains a lot of specially designed SWOT templates, SWOT matrix samples (SWOT analysis sample, SWOT sample in computers, SWOT matrix for business sphere, SWOT matrix educational, and many others), and also ready SWOT matrix objects that allow users create their own SWOT diagrams in minutes.Pyramid Diagram and Pyramid Chart
Pyramid Diagram, Triangle Chart or Triangular Diagram is a convenient and useful type of diagrams, which lets represent the data hierarchical structure and to illustrate the foundation-based relationships between the hierarchy levels. Pyramid Diagrams are used to visualize effectively the hierarchical, as well as proportional and foundation-based relationships, the process steps, the interconnections of organizational layers or topics. ConceptDraw DIAGRAM software enhanced with Pyramid Diagrams solution from Marketing area of ConceptDraw Solution Park is a powerful business charting software, that includes all required tools for designing the multilevel Pyramid Diagrams as quickly as possible. The build-in vector stencils and templates are the great aid for designers, a variety of examples and samples is a good base and source of inspiration. Use attractive and vivid 2D and 3D Pyramid Diagrams and Triangle Charts designed in ConceptDraw DIAGRAM to illustrate your documents, presentations, infographics, articles, reports, websites, etc.Target Diagram
Target Diagram is a convenient and visual way of presentation information which is popular and widely used in marketing, business and economics. ConceptDraw DIAGRAM diagramming and vector drawing software extended with Target and Circular Diagrams solution from the Marketing area of ConceptDraw Solution Park is ideal for fast and easy drawing a Target Diagram.Business Tools Perceptual Mapping
This sample shows the Perceptual map. It was created in ConceptDraw DIAGRAM diagramming and vector drawing software using the Matrices Solution from the Marketing area of ConceptDraw Solution Park. Perception Mapping helps organizations measure and transform all aspects of their business, people and culture. Perception Mapping allows to represent the complex relationships graphically, helps identify potential problems of the organization and make the best decisions.- Marketing Plan Infographic | HVAC Marketing Plan | Marketing plan ...
- Marketing mix - Wheel diagram | Marketing Diagrams | Marketing ...
- Marketing plan - Circular diagram | Pyramid Chart Examples | HVAC ...
- Pyramid Chart Examples | Marketing plan - Circular diagram ...
- Marketing Strategy Block Diagram
- Marketing Diagrams | Marketing Analysis Diagram | Marketing mix ...
- Target and Circular Diagrams | Relative Circular Diagram ...
- Sales Strategy Diagram
- Matrices | Ansoff's product / market matrix | SWOT matrix template ...
- Management pictograms - Vector stencils library | Marketing plan ...
- Circle-spoke diagram - Target market | Target and Circular ...
- Marketing Diagrams | Marketing Charts | Marketing Organization ...
- Porter's generic strategies matrix diagram | Block diagram - Porter's ...
- Diagrams For Customer Driven Marketing Strategy
- Marketing mix - Wheel diagram | Marketing mix diagram | Target ...
- Marketing Diagrams | Flowchart Marketing Process. Flowchart ...
- Marketing Plan Infographic | ConceptDraw Solution Park | Content ...
- Pyramid Chart Examples | Marketing Analysis Diagram | Marketing ...
- Diagram Of Sampling In Marketing Research
- Circle-spoke diagram - Target market | Marketing plan - Circular ...


