Business Process Elements: Data
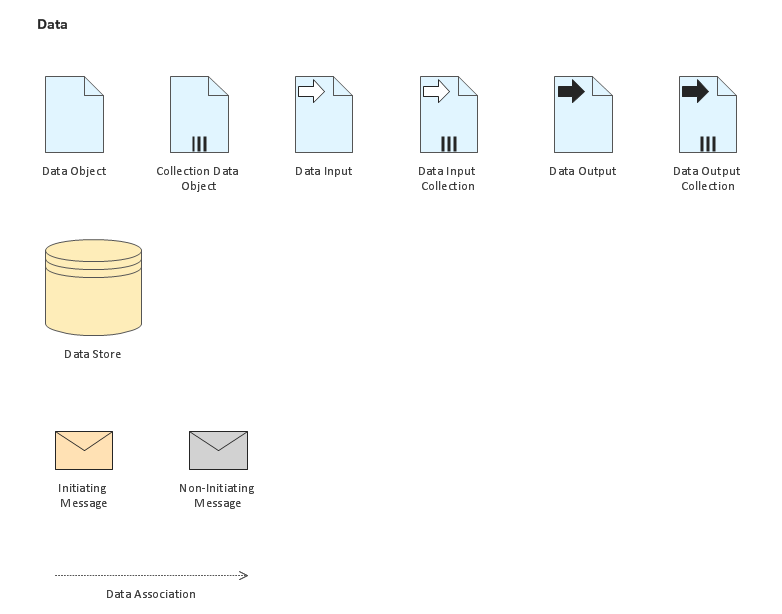
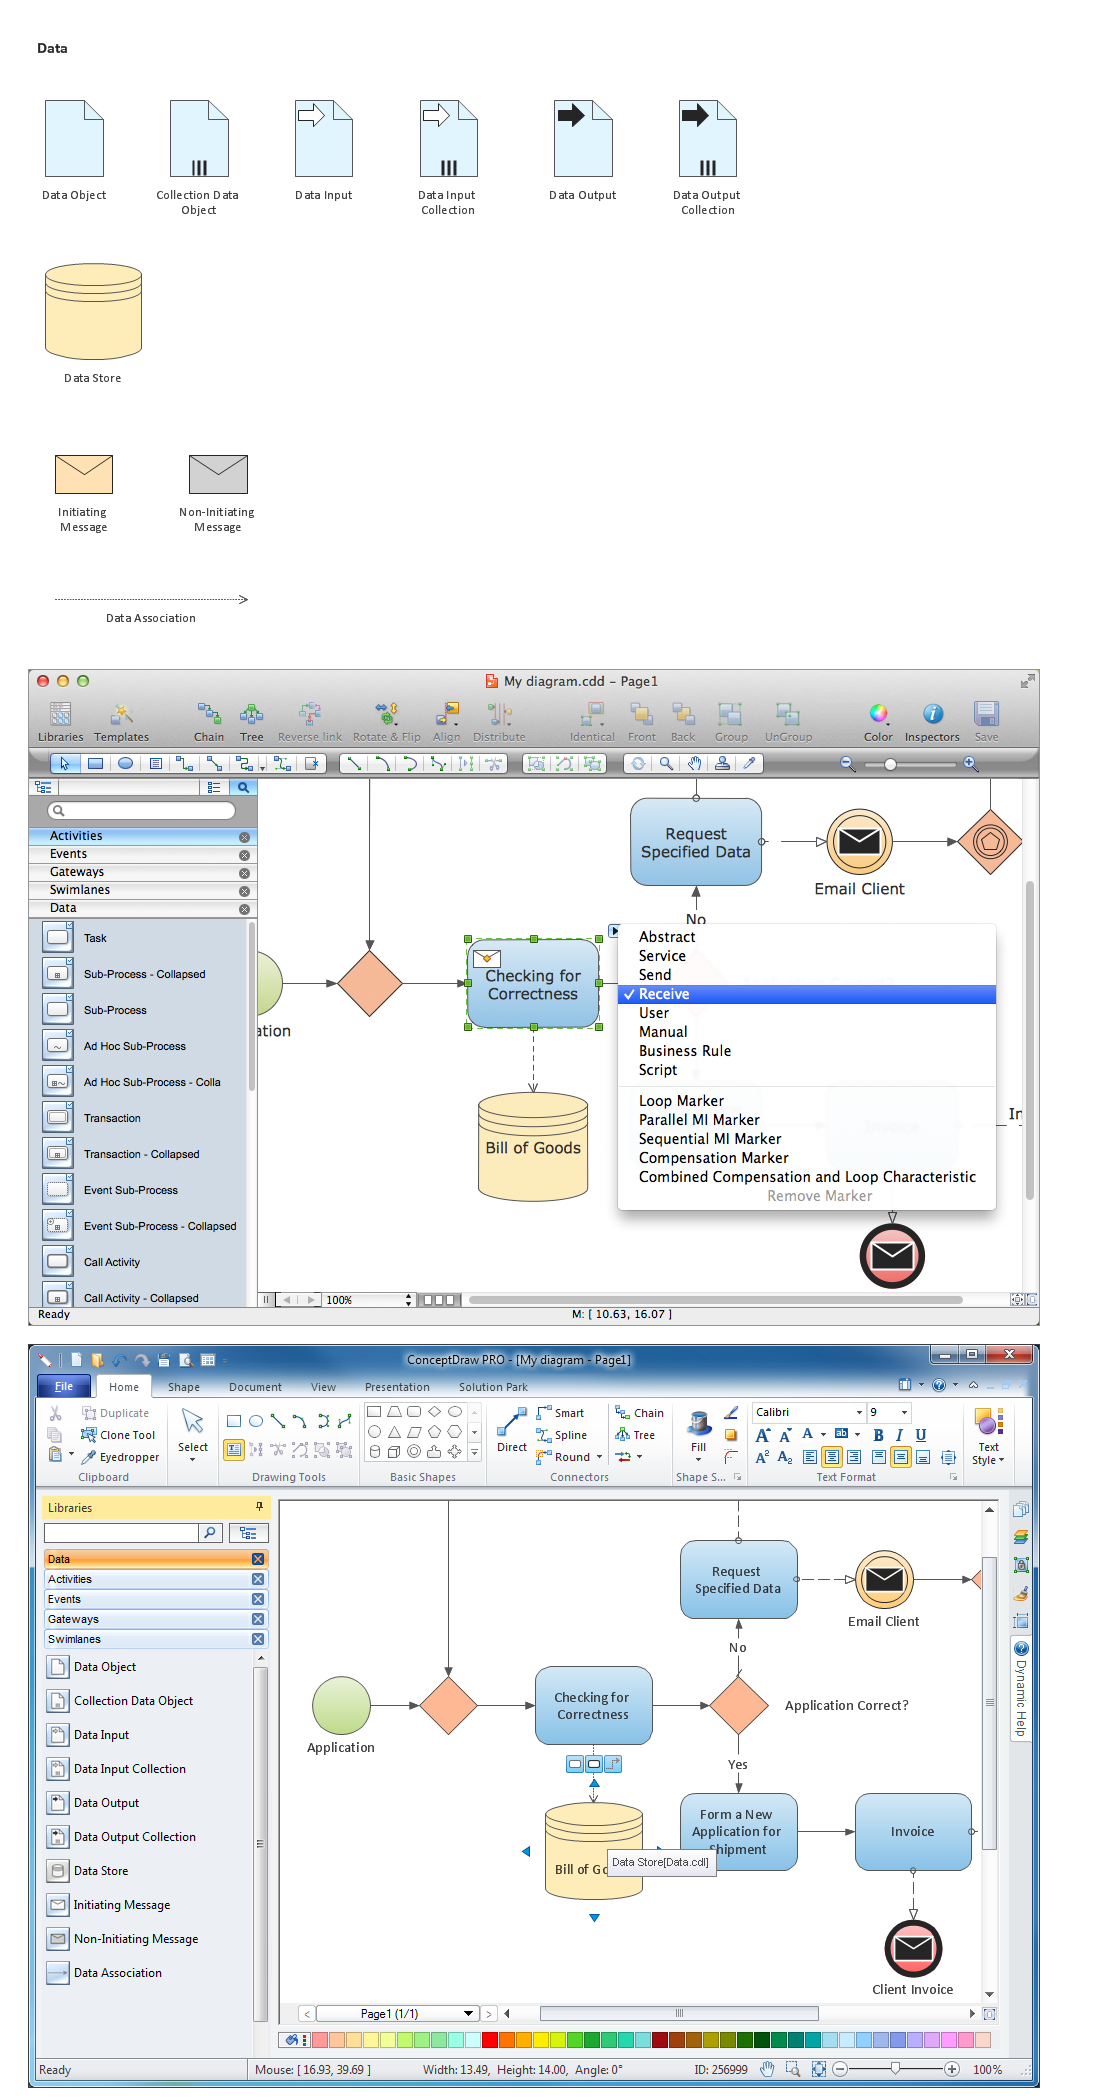
Create professional business process diagrams using ConceptDraw Data library with 10 objects from BPMN.
Diagramming Software for Business Process
Create professional business process diagram with ConceptDraw.
HelpDesk
Event-driven Process Chain (EPC) Diagram Software
An EPC diagram is a type of flowchart used in business process analysis. It shows different business processes through various work flows. The workflows are shown as processes and events that are related to different executes and tasks that allow business workflow to be completed. An EPC diagram shows different business processes through various workflows. The workflows are seen as functions and events that are connected by different teams or people, as well as tasks that allow business processes to be executed. The best thing about this type of enterprise modelling is that creating an EPC diagram is quick and simple as long as you have the proper tool. One of the main usages of the EPC diagrams is in the modelling, analyzing and re-engineering of business processes. With the use of the flowchart, businesses are able to see inefficiencies in the processes and modify to make them more productive. Event-driven process chain diagrams are also used to configure an enterprise resource plaProduct Overview
ConceptDraw PRO offers a wide choice of powerful and easy-to-use tools for quickly creating all kinds of charts and diagrams. Even if you've never used a drawing tool before, it's very easy to create high-quality professional graphic documents with ConceptDraw PRO.ConceptDraw PRO
ConceptDraw PRO is a powerful business and technical diagramming software tool that enables you to design professional-looking graphics, diagrams, flowcharts, floor plans and much more in just minutes. Maintain business processes performance with clear visual documentation. Effectively present and communicate information in a clear and concise manner with ConceptDraw PRO.
 Management
This solution extends ConceptDraw PRO v9 and ConceptDraw MINDMAP v7 with Management Diagrams and Mind Maps (decision making, scheduling, thinking ideas, problem solving, business planning, company organizing, SWOT analysis, preparing and holding meetings
HelpDesk
How to Create a SWOT Matrix Quickly
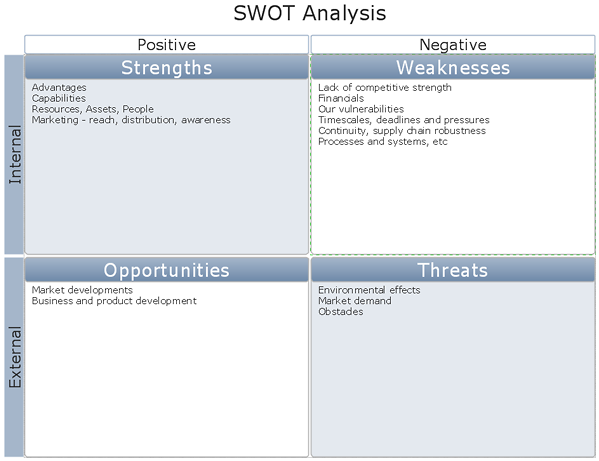
ConceptDraw PRO allow create SWOT Matrix in just one click for presenting analysis results preformed in mimd map structure using ConceptDraw MINDMAP.HelpDesk
How to Create a Fault Tree Analysis Diagram (FTD) in ConceptDraw PRO
Fault Tree Diagram are logic diagram that shows the state of an entire system in a relationship of the conditions of its elements. Fault Tree Diagram are used to analyze the probability of functional system failures and safety accidents. ConceptDraw PRO allows you to create professional Fault Tree Diagrams using the basic FTD symbols. An FTD visualize a model of the processes within a system that can lead to the unlikely event. A fault tree diagrams are created using standard logic symbols . The basic elements in a fault tree diagram are gates and events.- Fishbone diagram - Causes of low-quality output | Total Quality ...
- Basic Flowchart Symbols and Meaning | Business Process Mapping ...
- Input Output Operation In Os Flowchart
- Basic Flowchart Symbols and Meaning | Business Process ...
- Draw The Input Output Process Diagram
- Input Output Process Diagram
- How To Show Input And Output In Flowchart
- Business Input And Output Diagram
- Fishbone diagram - Causes of low-quality output | Event-driven ...
- Input Output Diagram Creator
- Drwa Input Output Process Diagram Mgt
- Input Output Symbol
- Basic Flowchart Symbols and Meaning | Process Flowchart | BPR ...
- In A Flowchart An Input Or Output Instruction Is Represented By
- Example Of Flowchart That Has Input Process Output And Discussion
- Supplier Input Process Output Customer
- Basic Flowchart Symbols and Meaning | Business Process ...
- Output Sign In Flowchart
- Mind Map For Business System
- Input Process Output Drawing Example


