How To Use Skype for Business
Using Skype for Business will let you control teams and deliver information worldwide in a real-time. This is an important tool for everyday work.
Mac Compatible Remote Presentation
Mac compatible remote presentation, A simple way to share your presentation remotely via Skype. All participants receive presentation file.
How to Collaborate in Business via Skype
Collaboration software for small and medium business allows communicate with partners around the globe via Skype.
 Presentation Exchange
This solution extends ConceptDraw MINDMAP software with the ability to import presentations from Microsoft PowerPoint, as well as enhancing its existing presentation capabilities.
Online Collaboration via Skype
Collaborating with co-workers is very important, not only in order to get things done effectively, but also to keep in touch with the outside world. Great way for business collaboration is Skype.
How to Create Presentation of Your Project Gantt Chart
During the planning, discussing and execution of a project you may need to prepare a presentation using project views such as the Gantt Chart, Multiproject Dashboard or Resource Usage View. It’s easy do with ConceptDraw PROJECT!Create a Presentation Using a Design Template
The intuitive interface of ConceptDraw MINDMAP and the Functional Tools overview below will guide you in creating and demonstrating powerful mind map presentations using template. An advanced tool allows you effectively generate, change, and update your presentation.Remote Projects in Corporate Strategy
Communication is the main challenge and the key success factor for organizational project management in company with remote projects. Communicating visually via Skype you bring all projects together to achieve corporate goals.
Flowchart Software
Flowchart is a simple diagram, map or graphical schematic representation the sequence of actions within a process. It is ideal for displaying how a process currently flows or can function ideally. The Flowcharts let define the steps and boundaries of a process, uncover problems or miscommunications. The Flowcharts are widely used in education, software development, business, economics, thanks to their visuality they are ideal for presentations, reports, for using on conferences to help the audience comprehend the content better, or easy find flaws in a process flow diagrams. ConceptDraw DIAGRAM is professional flowcharts software and feature-rich flowchart maker, which supports Mac OS X and Windows. It contains at ConceptDraw Solution Park a rich set of stencils and professional flowchart symbols for design. It lets create simply professional-looking Flowcharts based on thousand free flowchart templates, colored symbols and examples. ConceptDraw DIAGRAM is a 3 times cheaper alternative to MS Visio available for both Mac and PC. It’s is another full featured business and technical diagramming application that can easily take care of Visio files within OS X. Another bonus with ConceptDraw DIAGRAM – it's cross-platform. You can work on a document in both OS X and Windows, skipping Visio entirely.
Business and Finance Illustrations Example
ConceptDraw Business Finance Illustration examples and libraries contain vector clip art for drawing different Business and Finance Illustrations. You may find Advertising example, Project Management example, Business Model example and many more.Visual Presentations Made Easy with Diagramming Software
Automatically create a presentation-quality diagram in one click with ConceptDraw DIAGRAM.
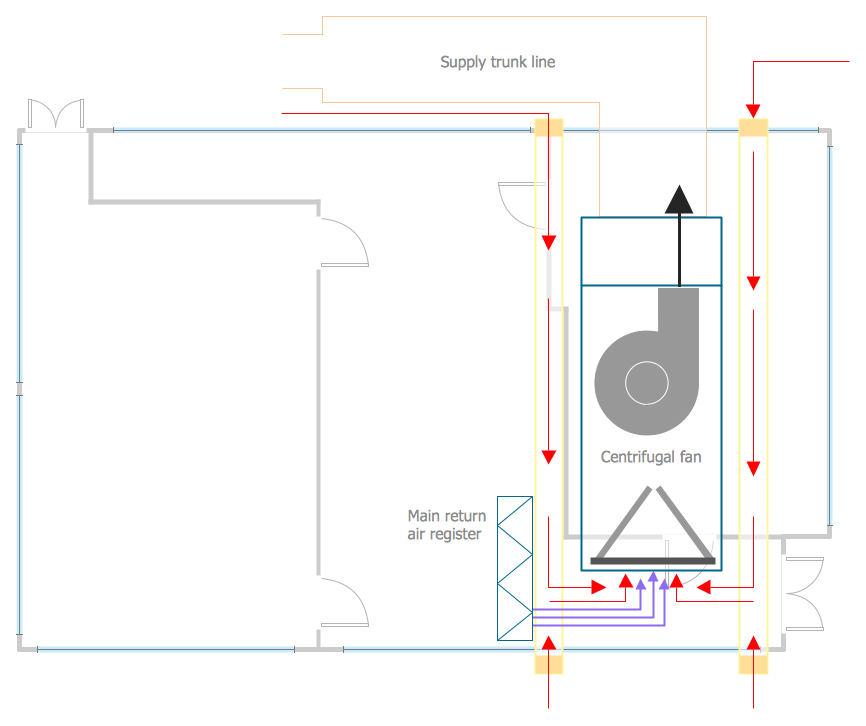
HVAC Business Plan
Long time you have looked for the convenient and helpful software for drawing HVAC Business Plan? Now ConceptDraw DIAGRAM diagramming and vector drawing software offers you the HVAC Plans Solution from the Building Plans Area that will help you create any desired HVAC Business Plan.
 Cross-Functional Flowcharts
Cross-functional flowcharts are powerful and useful tool for visualizing and analyzing complex business processes which requires involvement of multiple people, teams or even departments. They let clearly represent a sequence of the process steps, the order of operations, relationships between processes and responsible functional units (such as departments or positions).
 Remote Presentation for Skype
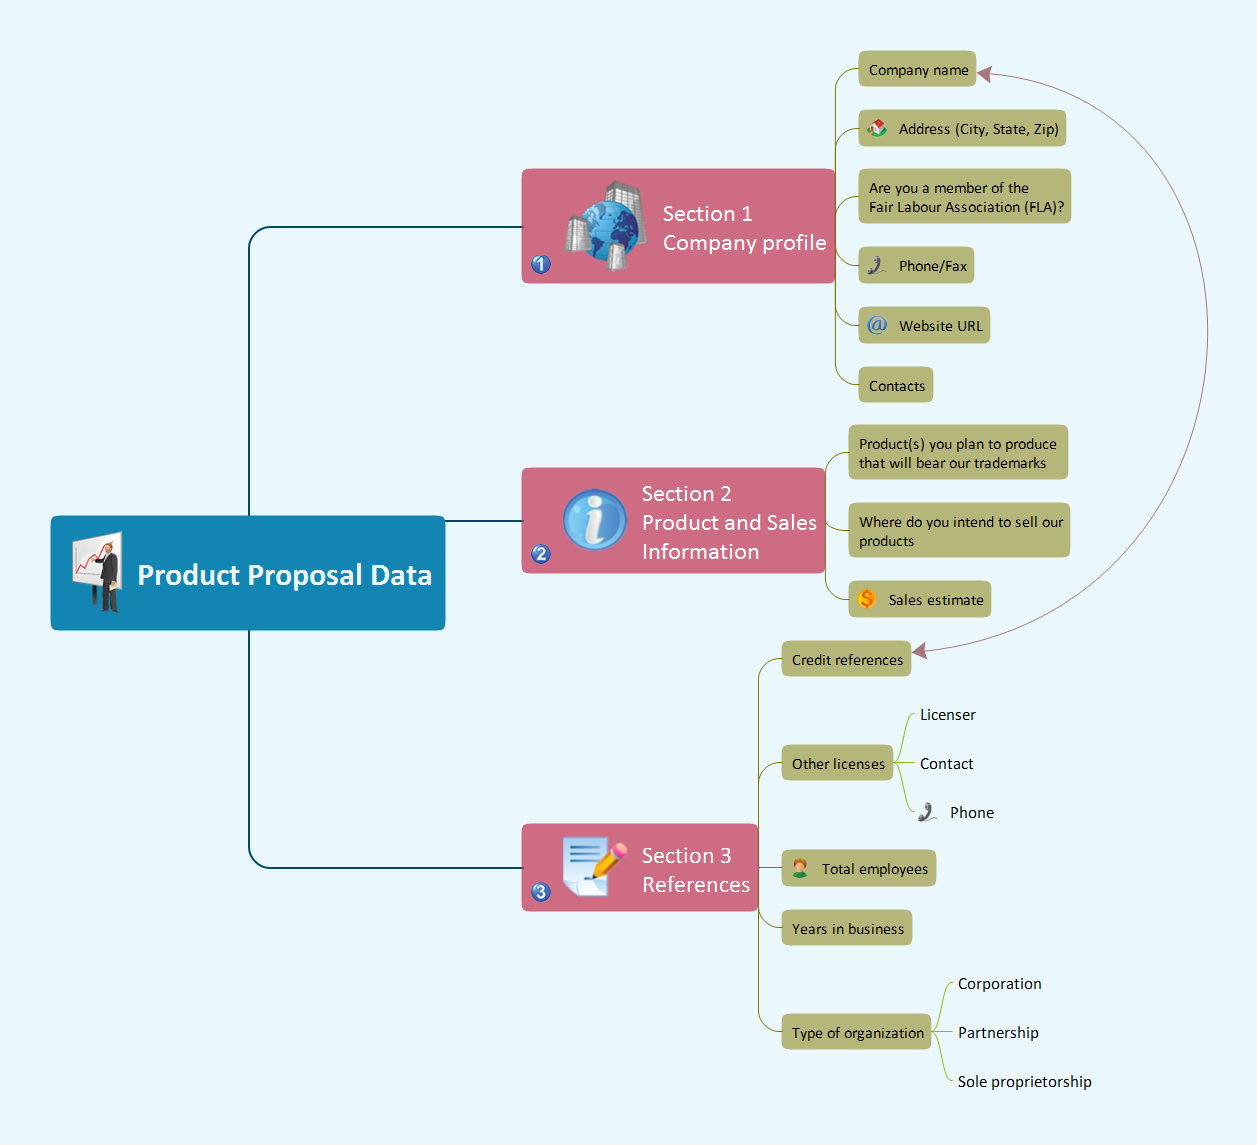
This solution extends ConceptDraw MINDMAP software with the ability to collaborate via Skype.
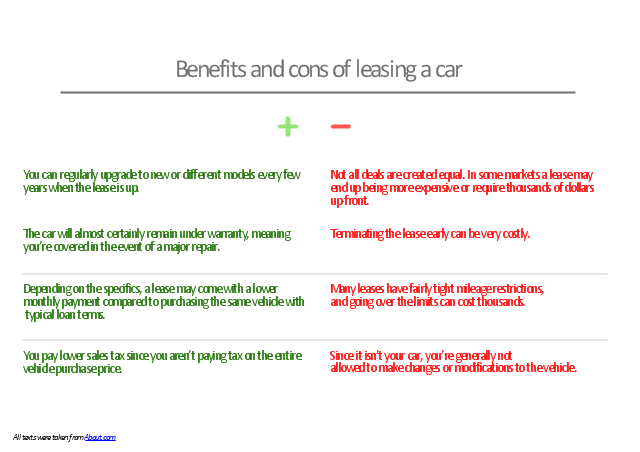
"Vehicle leasing is the leasing (or the use of) a motor vehicle for a fixed period of time at an agreed amount of money for the lease. It is commonly offered by dealers as an alternative to vehicle purchase but is widely used by businesses as a method of acquiring (or having the use of) vehicles for business, without the usually needed cash outlay. The key difference in a lease is that after the primary term (usually 2,3 or 4 years) the vehicle has to be returned to the leasing company for disposal." [Vehicle leasing. Wikipedia]
The presentation slide example "Benefits and cons of car leasing" was created in the ConceptDraw PRO diagramming and vector drawing software using the Presentation Clipart solution from the Illustration area of ConceptDraw Solution Park.
The presentation slide example "Benefits and cons of car leasing" was created in the ConceptDraw PRO diagramming and vector drawing software using the Presentation Clipart solution from the Illustration area of ConceptDraw Solution Park.
 Business and Finance
Use Business and Finance solution to make professional-looking documents, presentations and websites, business, finance, advertising, and project management illustrations, or any designs that requires clipart of currency, office, business, advertising, management, marketing, people, time, post, contacts, collaboration, etc.
Cross Functional Flowchart Examples
ConceptDraw DIAGRAM extended with Cross-Functional Flowcharts Solution from the Business Processes Area is a powerful software which offers a variety of Cross Functional Flowchart examples. The use of predesigned examples as the base for your own Cross Functional Flowchart Diagrams is a timesaving and useful way.Presenting Documents with Skype
Presentation tools. A convenient tool to present documents via Skype. Share your desktop, collaborate on documents in real-time and run a web conference one-on-one or one-to-many. A tool for sharing and presenting business documents via Skype. Allows to present Microsoft® Word®, Microsoft PowerPoint®, Microsoft Project® and plenty mindmapping formats.
Sales Growth. Bar Graphs Example
This sample was created in ConceptDraw DIAGRAM diagramming and vector drawing software using the Bar Graphs Solution from Graphs and Charts area of ConceptDraw Solution Park. It is Bar Graphs example, Sales Growth example, Column Chart Example - Sales Report.Data Flow Diagram
Data Flow Diagram (DFD) is the part of the Structured Systems Analysis and Design Methodology (SSADM), which is intended for information systems projection and analysis. Data Flow Diagrams allow graphically represent the data flows in information system and analyze the data processing during the structural projection. This type of diagrams lets visually show a work of information system and results of this work, it is often used in connection with human processes and can be displayed as Workflow diagram. Data Flow Diagram visualizes processes and functions, external entities, data depositories, and data flows connecting these elements and indicating direction and data character. Each of these elements used for DFD has its own graphical notation. There are two notations to draw DFDs - Yourdon & Coad and Gane & Sarson. ConceptDraw DIAGRAM extended with Data Flow Diagrams (DFD) solution from Software Developmant area is ideal for designing professional looking DFDs, which can be then easily exported in various formats.- Presentation Clipart | Holiday | Business and Finance | Sample Clip ...
- Presentation Clipart | Business and Finance | Business People ...
- Example Of Taxi Business Presentation
- Create Captivating Presentations Easily | How to Collaborate in ...
- Create Captivating Presentations Easily | Create a Presentation ...
- Example Of Business Presentation
- Presentation Clipart | Presentation design elements - Vector clipart ...
- Presentation Clipart | Business People Clipart | Arrows - Vector ...
- Presentation Clipart | Business People Clipart | Business and ...
- ConceptDraw PRO The best Business Drawing Software | Mac ...
- Business Processes | How To Create Presentation for Trainings and ...
- Design elements - Presentation symbols | Design elements - Logical ...
- Business and Finance | Business - Vector stencils library ...
- Presentation Clipart | Business People Clipart | Winter Sports Vector ...
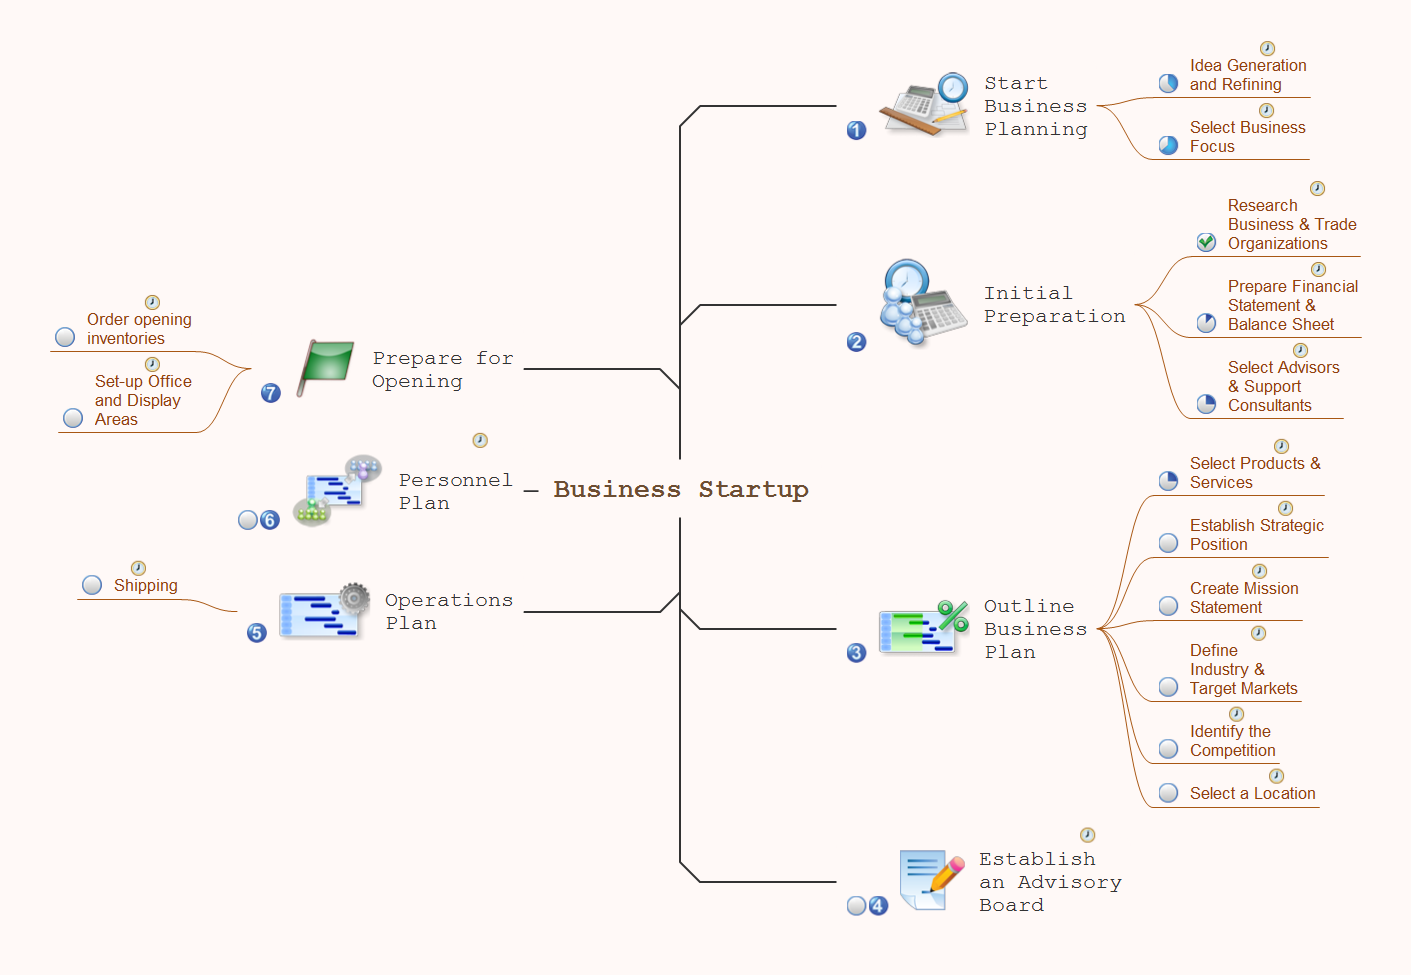
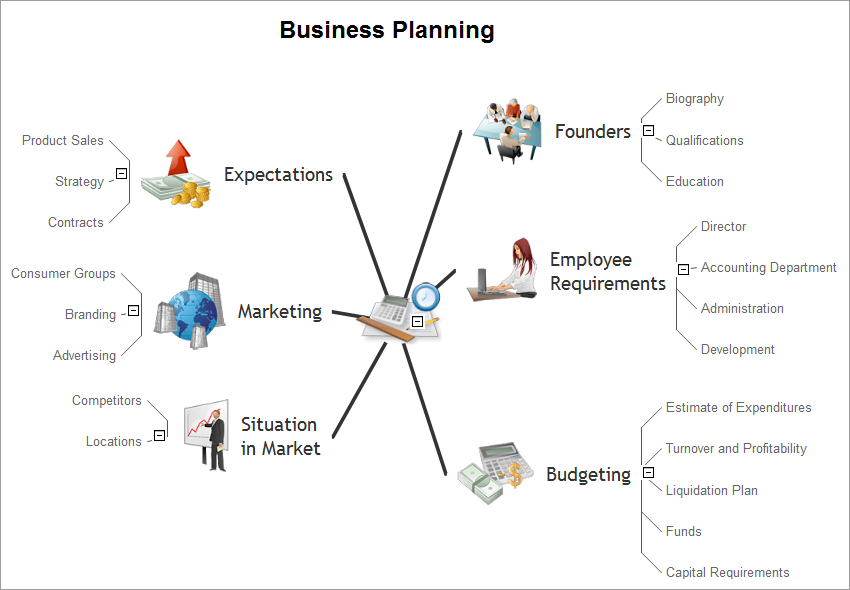
- Business Plan With Mind Map Sample
- Business Process Diagram | Business People Clipart | Presentation ...
- Presentation Examples
- Sample Presentation Of Cab Management System
- Presentation Clipart | Remote Presentation for Skype | Presentation ...
