Types of Flowcharts
A Flowchart is a graphical representation of process, algorithm, workflow or step-by-step solution of the problem. It shows the steps as boxes of various kinds and connects them by arrows in a defined order depicting a flow. There are twelve main Flowchart types: Basic Flowchart, Business Process Modeling Diagram (BPMN), Cross Functional Flowchart, Data Flow Diagram (DFD), IDEF (Integrated DEFinition) Flowchart, Event-driven Process Chain (EPC) Diagram, Influence Diagram (ID), Swimlane Flowchart, Process Flow Diagram (PFD), Specification and Description Language (SDL) Diagram, Value Stream Mapping, Workflow Diagram. Using the Flowcharts solution from the Diagrams area of ConceptDraw Solution Park you can easy and quickly design a Flowchart of any of these types. This solution offers a lot of special predesigned vector symbols for each of these widely used notations. They will make the drawing process of Flowcharts much easier than ever. Pay also attention for the included collection of ready Flowchart examples, samples and quick-start templates. This is business process improvement tools. If you are looking for MS Visio for your Mac, then you are out of luck, because it hasn't been released yet. However, you can use Visio alternatives that can successfully replace its functions. ConceptDraw PRO is an alternative to MS Visio for Mac that provides powerful features and intuitive user interface for the same.
 Event-driven Process Chain Diagrams
Event-driven Process Chain (EPC) Diagram is a type of flowchart widely used for modeling in business engineering and reengineering, business process improvement, and analysis. EPC method was developed within the Architecture of Integrated Information Systems (ARIS) framework.
Quality Management System
ConceptDraw PRO diagramming and vector drawing software extended with Total Quality Management (TQM) Diagrams solution from the Quality area of ConceptDraw Solution Park perfectly suits for development and visually representing a Quality Management System.
 Seven Basic Tools of Quality
Manage quality control in the workplace, using fishbone diagrams, flowcharts, Pareto charts and histograms, provided by the Seven Basic Tools of Quality solution.
 Quality Mind Map
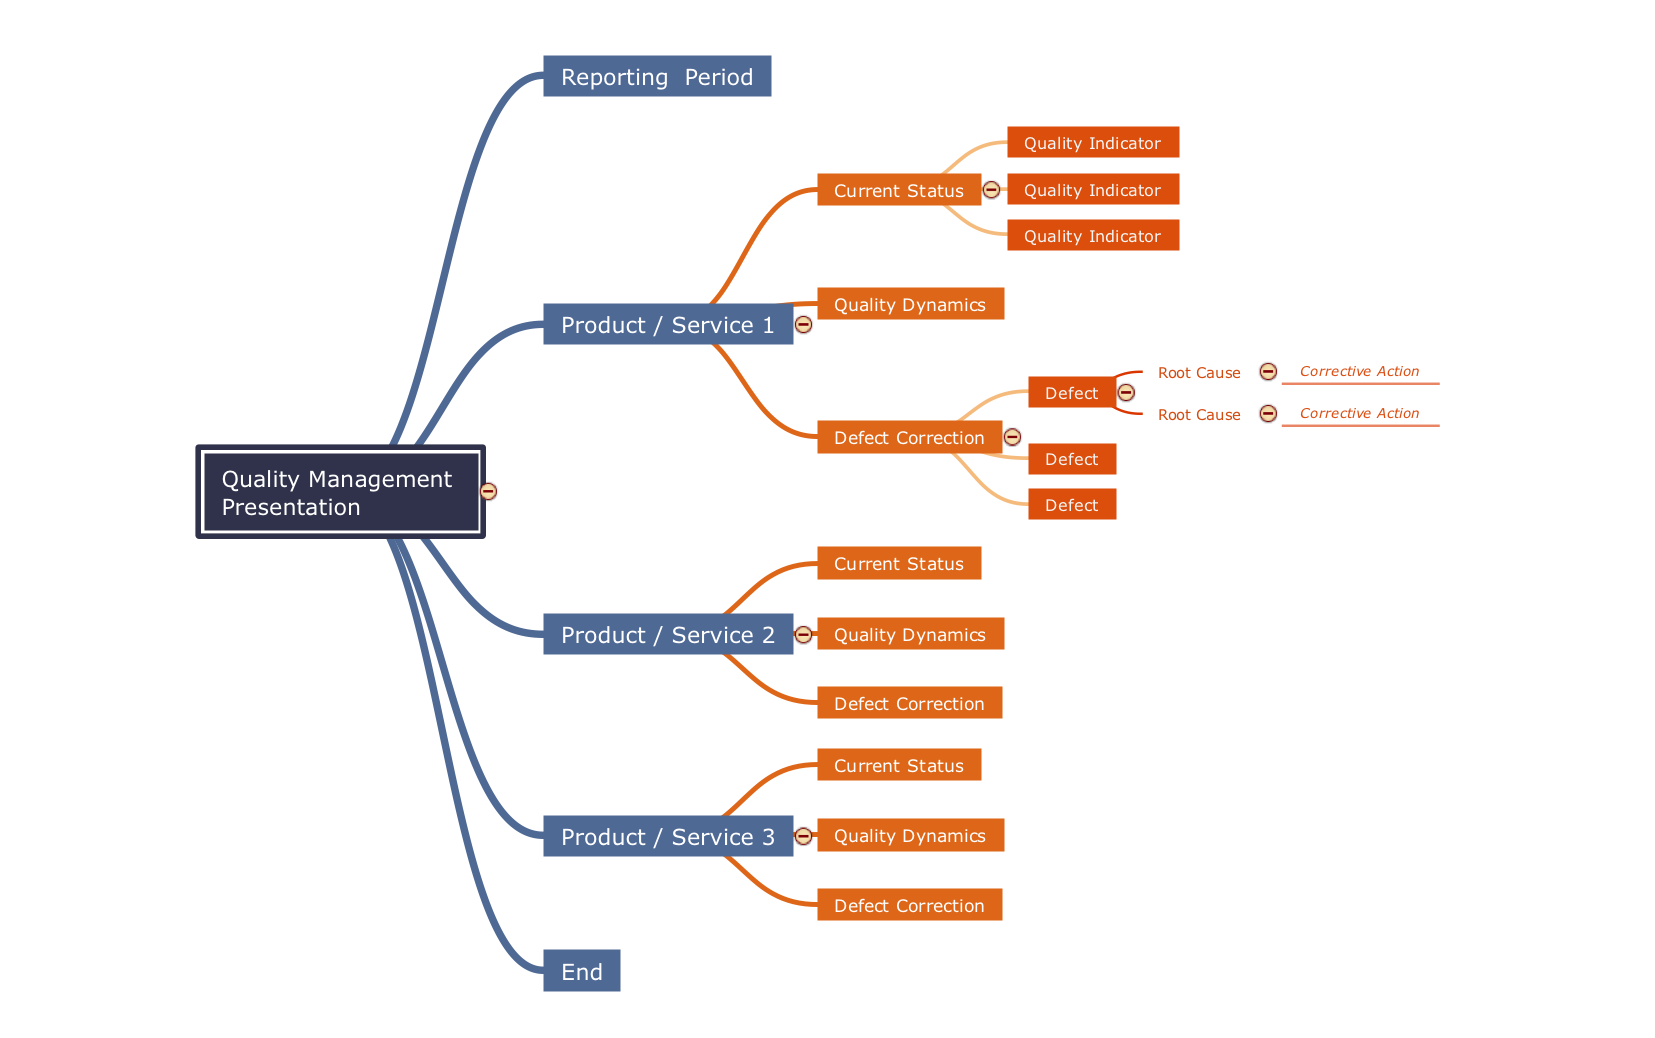
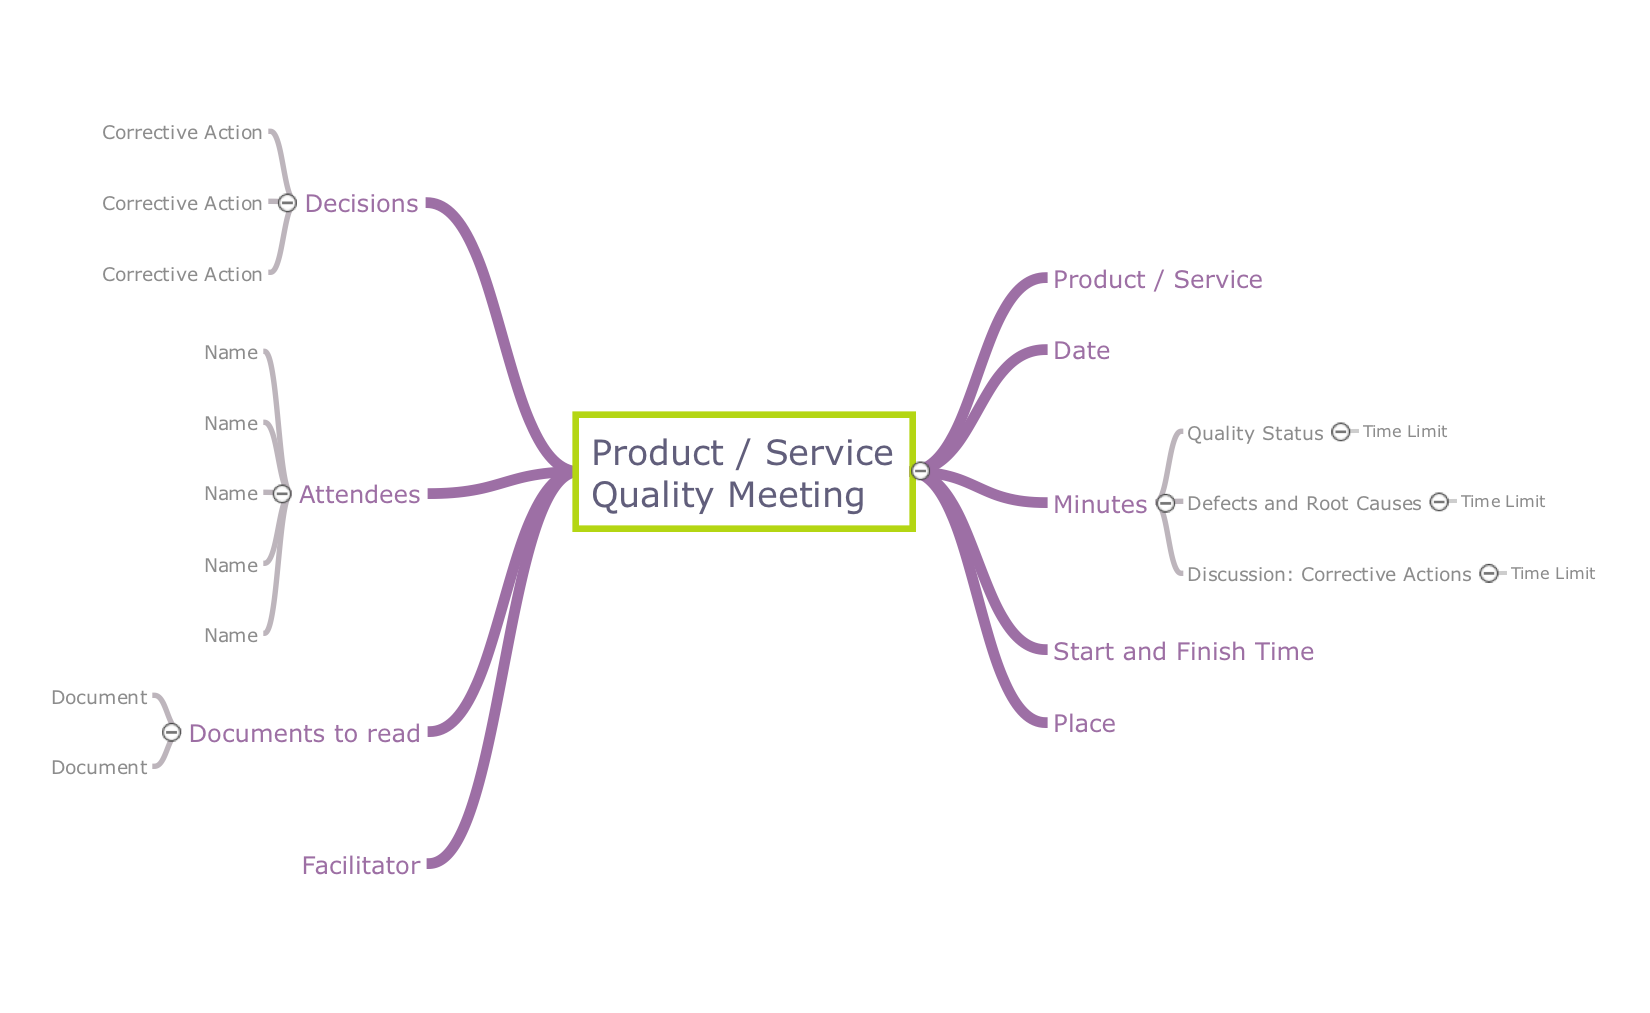
This solution extends ConceptDraw MINDMAP software with Quality Management Mind Maps (Presentations, Meeting Agendas, Problem to be solved).
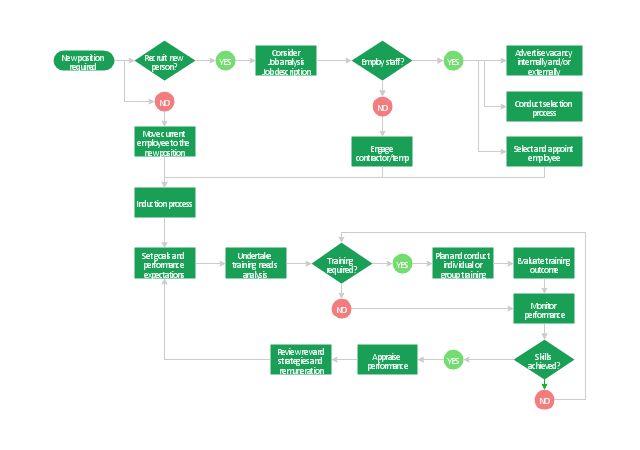
"Human resource management (HRM, or simply HR) is the management process of an organization's workforce, or human resources. It is responsible for the attraction, selection, training, assessment, and rewarding of employees, while also overseeing organizational leadership and culture and ensuring compliance with employment and labor laws. In circumstances where employees desire and are legally authorized to hold a collective bargaining agreement, HR will also serve as the company's primary liaison with the employees' representatives (usually a trades union).
HR is a product of the human relations movement of the early 20th century, when researchers began documenting ways of creating business value through the strategic management of the workforce. The function was initially dominated by transactional work, such as payroll and benefits administration, but due to globalization, company consolidation, technological advancement, and further research, HR now focuses on strategic initiatives like mergers and acquisitions, talent management, succession planning, industrial and labor relations, and diversity and inclusion." [Human resource management. Wikipedia]
The flow chart example "HR management process" was created using the ConceptDraw PRO diagramming and vector drawing software extended with the Flowcharts solution from the area "What is a Diagram" of ConceptDraw Solution Park.
Block Diagram Creator
A block diagram is a diagram of a system in which the principal parts or functions are represented by blocks connected by lines that show the relationships of the blocks. ConceptDraw PRO diagramming and vector drawing software extended with Block Diagrams Solution from the "Diagrams" Area is a powerful Block Diagram Creator.Quality Criteria MindMap
Quality Management Mind Maps - Presentations, Meeting Agendas, Problem will be solved. The visual form of mind maps is helpful in all stages of quality management, from describing problem to describing and documenting a decision.Quality Mind Maps
ConceptDraw map templates are great starting points to identify, track, and address quality initiatives in your organization.- Business Process Management | Sales Process Management ...
- Process Flow Chart Management
- Talent management process | HR management process - Flowchart ...
- HR management process - Flowchart | Types of Flowchart ...
- Example Of Management Process
- How to Create a HR Process Flowchart Using ConceptDraw PRO ...
- The Diagram Of The Strategic Management Process
- Flow chart Example. Warehouse Flowchart | How to Draw a Process ...
- Management Process Flow Chart
- Human Resource Management | Project — Assigning Resources ...
- HR management process - Flowchart | Process Flowchart | How to ...
- Types of Flowchart - Overview | HR management process ...
- HR management process - Flowchart | HR Flowcharts | Types of ...
- Types of Flowchart - Overview | Process Flowchart | HR ...
- HR management process - Flowchart | How to Create a HR Process ...
- Flow Chart Of Management Process
- How to Create a HR Process Flowchart Using ConceptDraw PRO ...
- Quality Management Teams | Total Quality Management Value ...
- HR Flowchart Symbols | HR management process - Flowchart ...
- HR management process - Flowchart | HR Flowchart Symbols ...


