BPMN 2.0
ConceptDraw DIAGRAM diagramming and vector drawing software offers the Business Process Diagram Solution from the Business Processes Area of ConceptDraw Solution Park with powerful tools to help you easy represent the business processes and create the business process diagrams based on BPMN 2.0 standard.Workflow Diagram Software Mac
ConceptDraw DIAGRAM software is the best Mac software for drawing workflow diagrams. Its rich set of samples and templates, and specific features to draw diagrams faster make this software as comfortable as possible for drawing workflow diagrams. Use the ConceptDraw DIAGRAM professional Mac OS X software for drawing workflow diagram. The Workflow Diagrams solution with its libraries and templates set make the possibility to identify resources that are required for work goal implementation. The process flow diagram identify flow which occurs as network of process dependencies, organizational decisions and interactions between departments. Usually workflow diagrams show business participants actions that carry product or service to the final destination, the consumer.Business Process Flow Diagram
Business Process Flow Diagram is a graphical presentation of business processes and process flows. It is one of the main tool of business analysis and business process re-engineering that lets identify and easy understand process flows within organization. ConceptDraw DIAGRAM extended with Business Process Workflow Diagrams solution from the Business Processes area of ConceptDraw Solution Park is a powerful software which lets easy design Business Process Flow Diagram of any complexity.
 Business Process Workflow Diagrams
The Business Process Workflow Diagrams solution enhances the ConceptDraw DIAGRAM functionality with predesigned examples, samples and a numerous collection of predesigned vector objects of workflow chart elements, icons, arrows, connectors, and varied wor
Flowchart
The Flowcharts are widespread in various fields and include the multitude of types. They are dedicated to representation the algorithms, processes, workflows of any complexity in a clear and intuitive format. The Flowcharts are commonly used in software development as a visual tool for illustration algorithms and logic of computer programs, in business for illustration business scenarios, in education, and so on. For drawing the Flowchart are used the special object blocks, among them rectangle or box used to represent an activity or step, rounded box or oval to depict Start / End, diamond to represent the decision point (involves the branching yes/no), circle used to represent the point of connection, parallelogram to represent the Input / Output, and some others. With ConceptDraw DIAGRAM including Flowcharts solution it is easy to create professional-looking Flowchart diagrams of any complexity and any degree of detailing. Succeed in drawing the Flowcharts using quick-start templates, predesigned samples and extensive libraries of ready-made flowchart symbols, blocks and icons.Process Flow Chart
A Process Flow Chart is a type of flowchart which is mostly used in industrial, chemical and process engineering for illustrating high-level processes, major plant processes and not shows minor details. ConceptDraw DIAGRAM diagramming and vector drawing software extended with Flowcharts Solution from the "Diagrams" Area of ConceptDraw Solution Park is the best way to create Process Flow Chart and other types of flowcharts.Process Flow Diagram
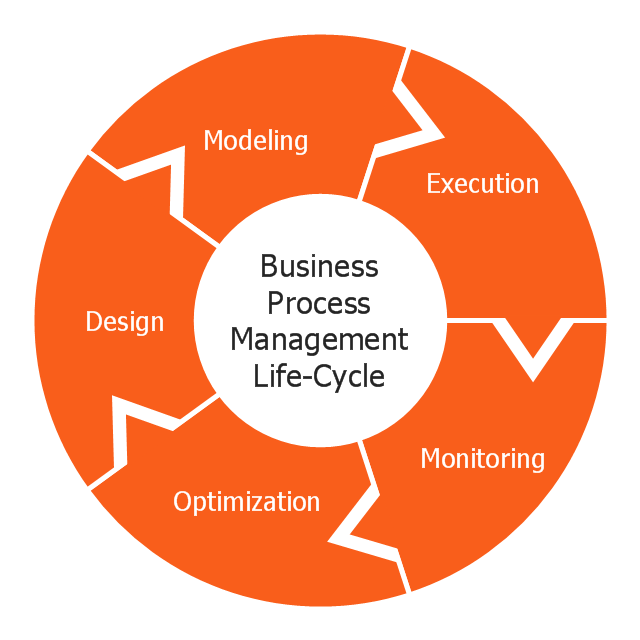
A Process Flow Diagram (PFD) is a diagram which shows the relationships between the main components in a system. Process Flow Diagrams are widely used by engineers in chemical and process engineering, they allows to indicate the general flow of plant process streams and equipment, helps to design the petroleum refineries, petrochemical and chemical plants, natural gas processing plants, and many other industrial facilities. ConceptDraw DIAGRAM diagramming and vector drawing software extended with powerful tools of Flowcharts Solution from the "Diagrams" Area of ConceptDraw Solution Park is effective for drawing: Process Flow Diagram, Flow Process Diagram, Business Process Flow Diagrams.This circular arrows diagram sample shows business process management life cycle.
It was designed on the base of the Wikimedia Commons file: Business Process Management Life-Cycle.svg. [commons.wikimedia.org/ wiki/ File:Business_ Process_ Management_ Life-Cycle.svg]
This file is licensed under the Creative Commons Attribution-Share Alike 3.0 Unported license. [creativecommons.org/ licenses/ by-sa/ 3.0/ deed.en]
"BPM life-cycle.
Business process management activities can be grouped into six categories: vision, design, modeling, execution, monitoring, and optimization.
Functions are designed around the strategic vision and goals of an organization. Each function is attached with a list of processes. Each functional head in an organization is responsible for certain sets of processes made up of tasks which are to be executed and reported as planned. Multiple processes are aggregated to function accomplishments and multiple functions are aggregated to achieve organizational goals." [Business process management. Wikipedia]
The arrow donut chart example "BPM life cycle" was created using the ConceptDraw PRO diagramming and vector drawing software extended with the Circular Arrows Diagrams solution from the area "What is a Diagram" of ConceptDraw Solution Park.
Business Process Workflow Diagram
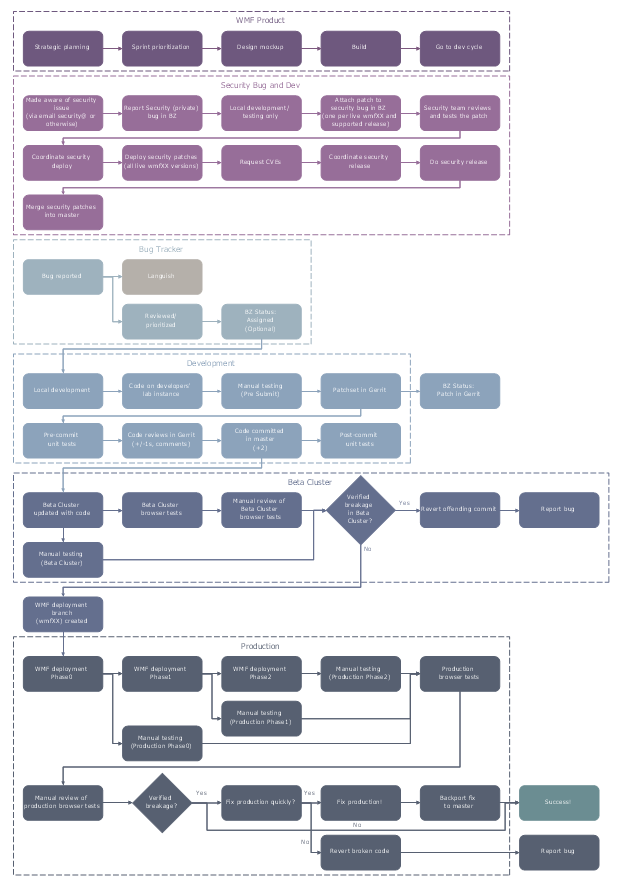
Business Process Workflow Diagram is a professional visual tool that is widely applied for business development, business analysis, business process optimization and documenting business processes. Business Process Workflow Diagram lets depict in details the steps of business processes and flow of tasks between them, the execution of business processes, transfer of data and documents. The workflows on the Business Process Workflow Diagram are represented using the set of common symbols which let easy illustrate business processes and process flows, depict the start, all major steps and end of the process, what data are used by the process, how the data flow through the business areas within scope of our project, how the tasks are executed and by who, and how workers interact with each other.
Process Mapping
ConceptDraw DIAGRAM diagramming and vector drawing software offers the unique Business Process Mapping Solution from the Business Processes Area of ConceptDraw Solution Park. Powerful drawing tools of this solution make it effective Business Process Mapping software and help easy design professional looking business process diagrams and flowcharts.
 Azure Architecture
Azure Architecture solution bundles into one handy tool everything you need to create effective Azure Architecture diagrams. It adds the extra value to versatile ConceptDraw DIAGRAM software and extends the users capabilities with comprehensive collection of Microsoft Azure themed graphics, logos, preset templates, wide array of predesigned vector symbols that covers the subjects such as Azure management, Azure storage, and Azure services, amongst others, and allow you to illustrate Azure Architecture diagrams at any degree of complexity, to present visually your Azure cloud system architecture with professional style, to design Azure cloud topology, to document Windows Azure Architecture and Azure Cloud System Architecture, to visualize the great abilities and work of Microsoft Azure Cloud System and Azure services.
Gantt charts for planning and scheduling projects
ConceptDraw PROJECT is an excellent simple project scheduling software. It maintain classic project gantt charts and the line of professional reports on resources usage. It include handy critical path scheduling software tools and diagraming tools which helps prepare the presentation of project status. It include project tracking dashboard to keep project metrics upto date, also it have handy feature to export project management dashboard in excel file.HelpDesk
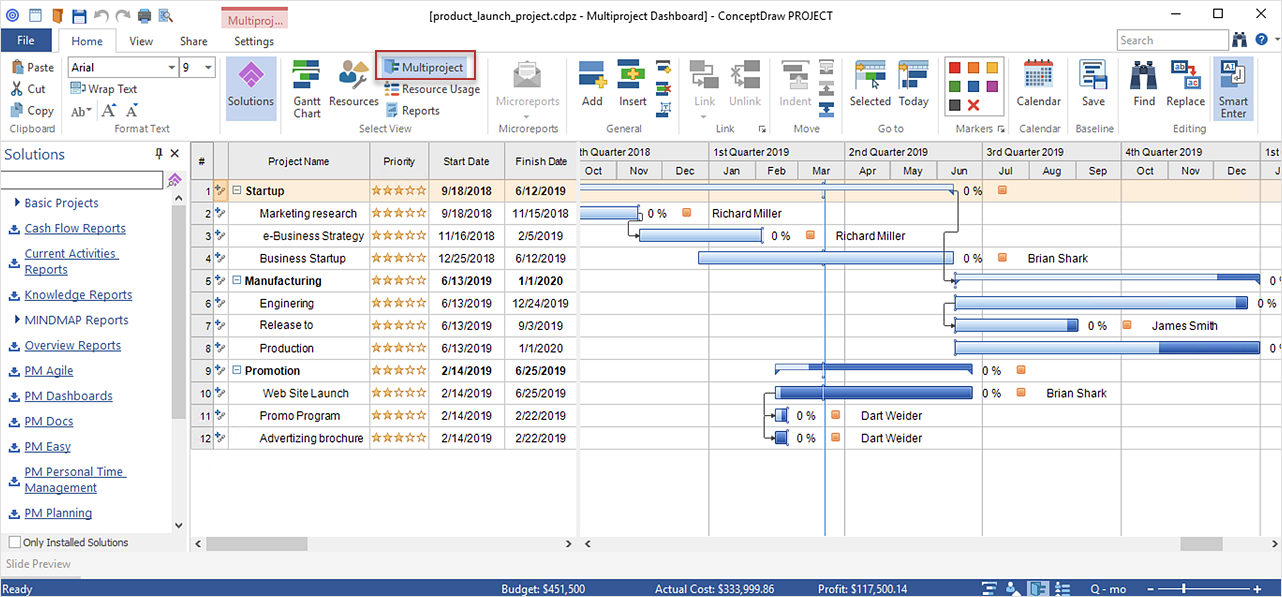
How to Manage Multiple Projects on Windows
ConceptDraw PROJECT lets you to track multiple projects at the same time.Probability Quality Control Tools
The Total Quality Management Diagram solution helps your organization visualize business and industrial processes. Create Total Quality Management diagrams for business process with ConceptDraw software.- SYSML | AWS Architecture Diagrams | Business Process Diagrams ...
- Revealing the Potential of Manufacturing Processes
- Flowchart | Process Flow Diagram | Flowchart Components ...
- Business Process Flowchart Symbols | ER Diagram for Cloud ...
- Business Process Flowchart Symbols | TQM Software — Build ...
- Enterprise dashboard | Business process Flow Chart - Event-Driven ...
- Process Flowchart | Flowchart Definition | Project management life ...
- SYSML | Flowcharts | Process Flowchart | Remote Computer ...
- Sales Monitoring System
- SYSML | Process Flowchart | Security and Access Plans | Activity ...
- SYSML | Flowcharts | Process Flowchart | Remote Monitoring ...
- Class Daigram For Transport Monitoring System
- Software Engineering Remote Computer Monitoring Sequence
- Competing consumers pattern | Process Flowchart | Health endpoint ...
- Process Flow Diagram | Technical Flow Chart | Flowchart ...
- Types of Flowchart - Overview | Business Process Diagrams | Think ...
- Flowchart Components | Sales Process Flowcharts | BPMN 2.0 ...
- Business Process Flowchart Symbols | Value stream with ...
- Basic Flowchart Symbols and Meaning | Sales Process Flowchart ...


