 Cross-Functional Flowcharts
Cross-functional flowcharts are powerful and useful tool for visualizing and analyzing complex business processes which requires involvement of multiple people, teams or even departments. They let clearly represent a sequence of the process steps, the order of operations, relationships between processes and responsible functional units (such as departments or positions).
The vector stencils library "Workflow management" contains 22 icons.
Use it to design your business process workflow diagrams with ConceptDraw PRO software.
"Management in businesses and organizations is the function that coordinates the efforts of people to accomplish goals and objectives by using available resources efficiently and effectively.
Management includes planning, organizing, staffing, leading or directing, and controlling an organization to accomplish the goal or target. Resourcing encompasses the deployment and manipulation of human resources, financial resources, technological resources, and natural resources." [Management. Wikipedia]
The icons example "Design elements - Workflow management" is included in the Business Process Workflow Diagrams solution from the Business Processes area of ConceptDraw Solution Park.
Management icons
 Logistics Flow Charts
Logistics Flow Charts solution extends ConceptDraw DIAGRAM functionality with opportunities of powerful logistics management software. It provides large collection of predesigned vector logistic symbols, pictograms, objects and clipart to help you design with pleasure Logistics flow chart, Logistics process flow diagram, Inventory flow chart, Warehouse flowchart, Warehouse management flow chart, Inventory control flowchart, or any other Logistics diagram. Use this solution for logistics planning, to reflect logistics activities and processes of an enterprise or firm, to depict the company's supply chains, to demonstrate the ways of enhancing the economic stability on the market, to realize logistics reforms and effective products' promotion.
Beauty of Event-driven Process Chain (EPC) diagrams

The Best Tool for Business Process Modeling

 Flowcharts
The Flowcharts solution for ConceptDraw DIAGRAM is a comprehensive set of examples and samples in several varied color themes for professionals that need to represent graphically a process. Solution value is added by the basic flow chart template and shapes' libraries of flowchart notation. ConceptDraw DIAGRAM flow chart creator lets one depict the processes of any complexity and length, as well as design the Flowchart either vertically or horizontally.
Business Process Flowchart Symbols

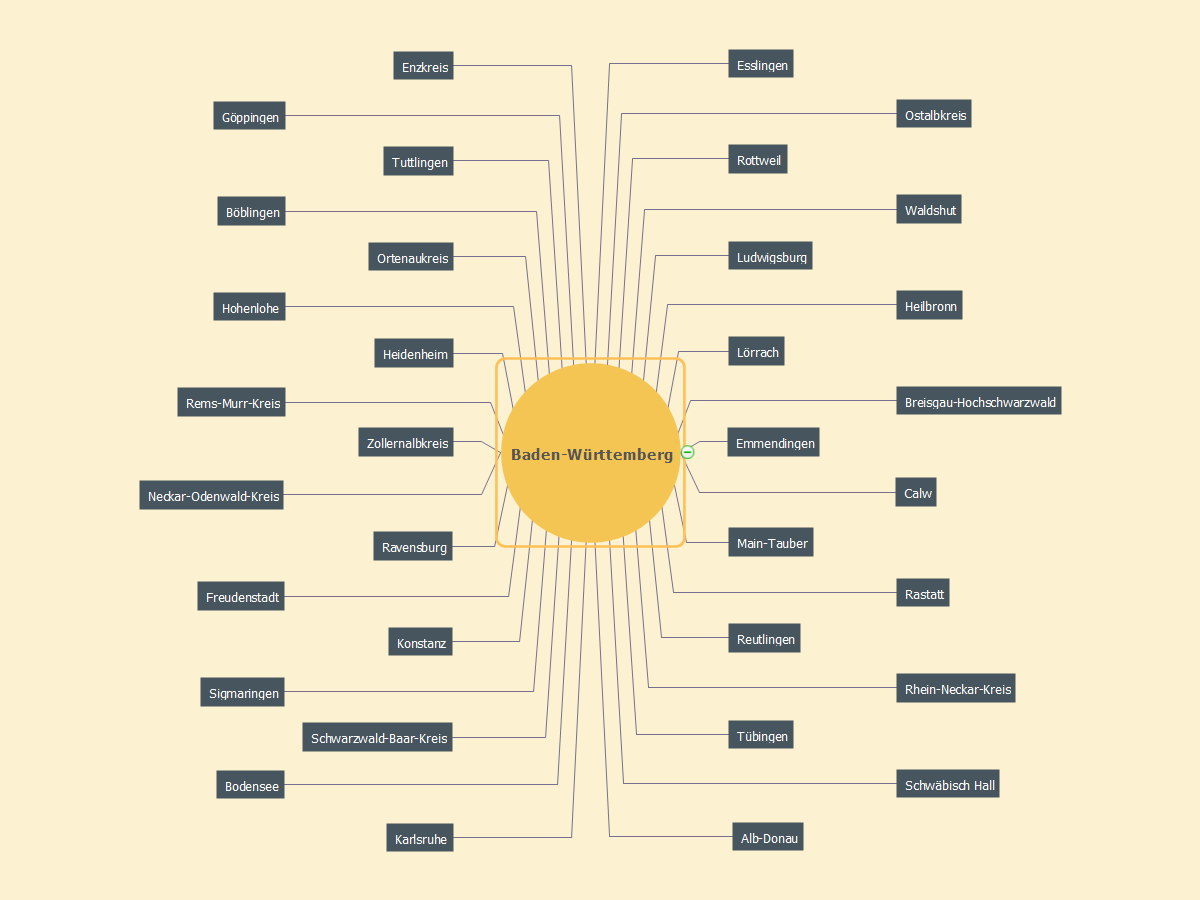
MindMap of Baden-Württemberg Districts
Process Flow Chart

- How To Start Natural Resource Using Diagram
- Natural Resources Management Bar Chart
- Natural Resource And Development Flow Chart
- Diagrams Of Natural Resources
- Natural Resources And Human Resources Diagram
- Natural Resources Diagram
- Natural Resources Bar Graph Maths
- How I Can Draw Natural Resources Diagram In Chart
- Natural Resources Graph Image
- A Line Graph Of Natural Resources