Business Productivity - Marketing
Mind Map is effective tool for depiction the main idea and related concepts, and representation a thought process. Mind Maps have essential value in marketing field, advertising and sales. They help successfully accomplish marketing goals and easy get marketing answers, to achieve a sustainable competitive advantages and increasing sales. Mind Maps help in new product development, they allow to generate and structure ideas about its properties and features, to define the target customers, brainstorm the key words and phrases for advertising and sales materials. ConceptDraw MINDMAP is a perfect marketing diagramming and marketing strategy tool that help accomplish marketing goals, represent marketing information and easy design Marketing Mind Maps and Marketing Diagrams (Marketing Step Chart, Marketing Mix Diagram, Market Environment Analysis Charts, Sales Pyramids, Target and Marketing Scope Diagrams, Feature Comparison Chart, Product Position Map, Products Comparison Chart, Timeline, SWOT, Boston Growth Matrix, Ansoff Product-Market Growth Matrix) for further using in visual documents and presentations.Business Productivity - Management
The widespread of Mind Maps in the field of management is justified and very convenient. The managers and leaders work with large amount of information and data, and need the useful tools for its structuring and systemizing. They prefer to use the powerful Mind Mapping software that gives them a lot of benefits. ConceptDraw MINDMAP is professional software for management, business planning, strategic planning, business productivity and development. It provides the powerful tools which help managers to be effective and improve their productivity, supports them in easy visual documenting and communication the management information. Use ConceptDraw MINDMAP to build the Management Diagrams (Matrices, Organizational Charts, Deployment Charts, Timelines, Cause & Effect (Fishbone) Diagrams) and key management Mind Maps (SWOT analysis, problem solving, decision making, business planning, scheduling, thinking ideas, company organizing, preparing and holding the meetings and presentations) quickly and easily.Business Productivity - Quality
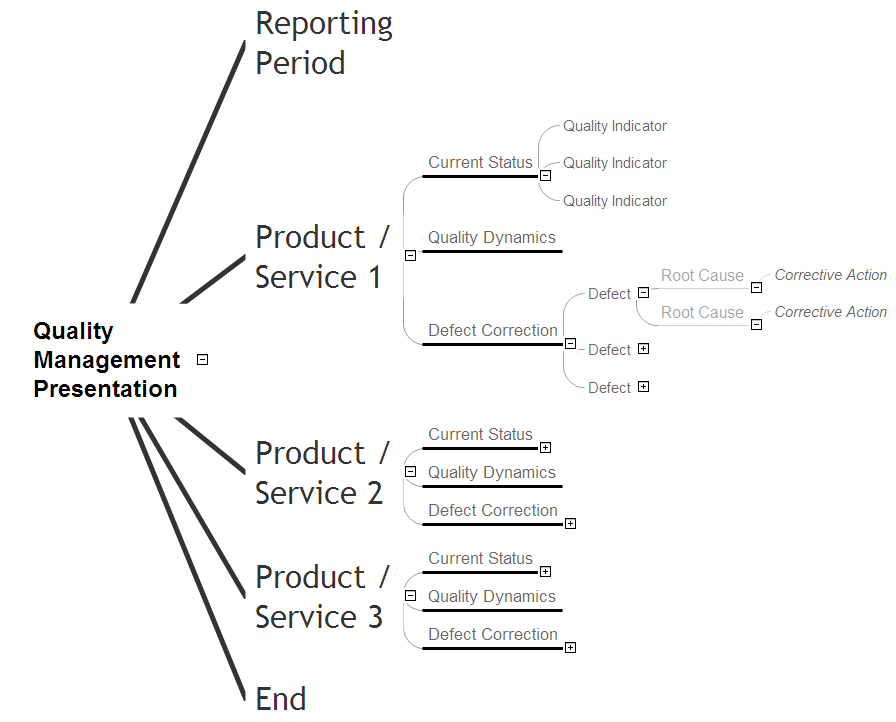
Quality control is a process directed on the maintaining of proper standards in manufacturing and engineering, on the monitoring of manufacturing defects and their elimination. The quality control process is quite capacious and extensive, and in many cases requires the use of specialized software in help to quality managers, to facilitate their work. This process will be effective with Flowcharts and Mind Maps that are recognized as the main tools in quality management, and are perfect for visualization the key quality points, quality instructions and depiction in details the quality control process. The ideal software for Mind Maps design is offered by ConceptDraw Office suite, it is a ConceptDraw MINDMAP. The Quality Mind Maps solution included to ConceptDraw Solution Park and ConceptDraw MINDMAP application provide creative and professional approach to business productivity and visualization quality processes. They support you in tasks of drawing Quality Management Diagrams and Mind Maps, such as Value Stream Maps, Total Quality Management Mind Maps, Quality Management Presentations, Quality Meeting Diagrams, etc.
 Business Productivity Area
Business Productivity Solutions extend ConceptDraw products with tools for making presentations, conducting meetings, preparing documents, brainstorming, or building new strategies.
Business Process Modeling Tools
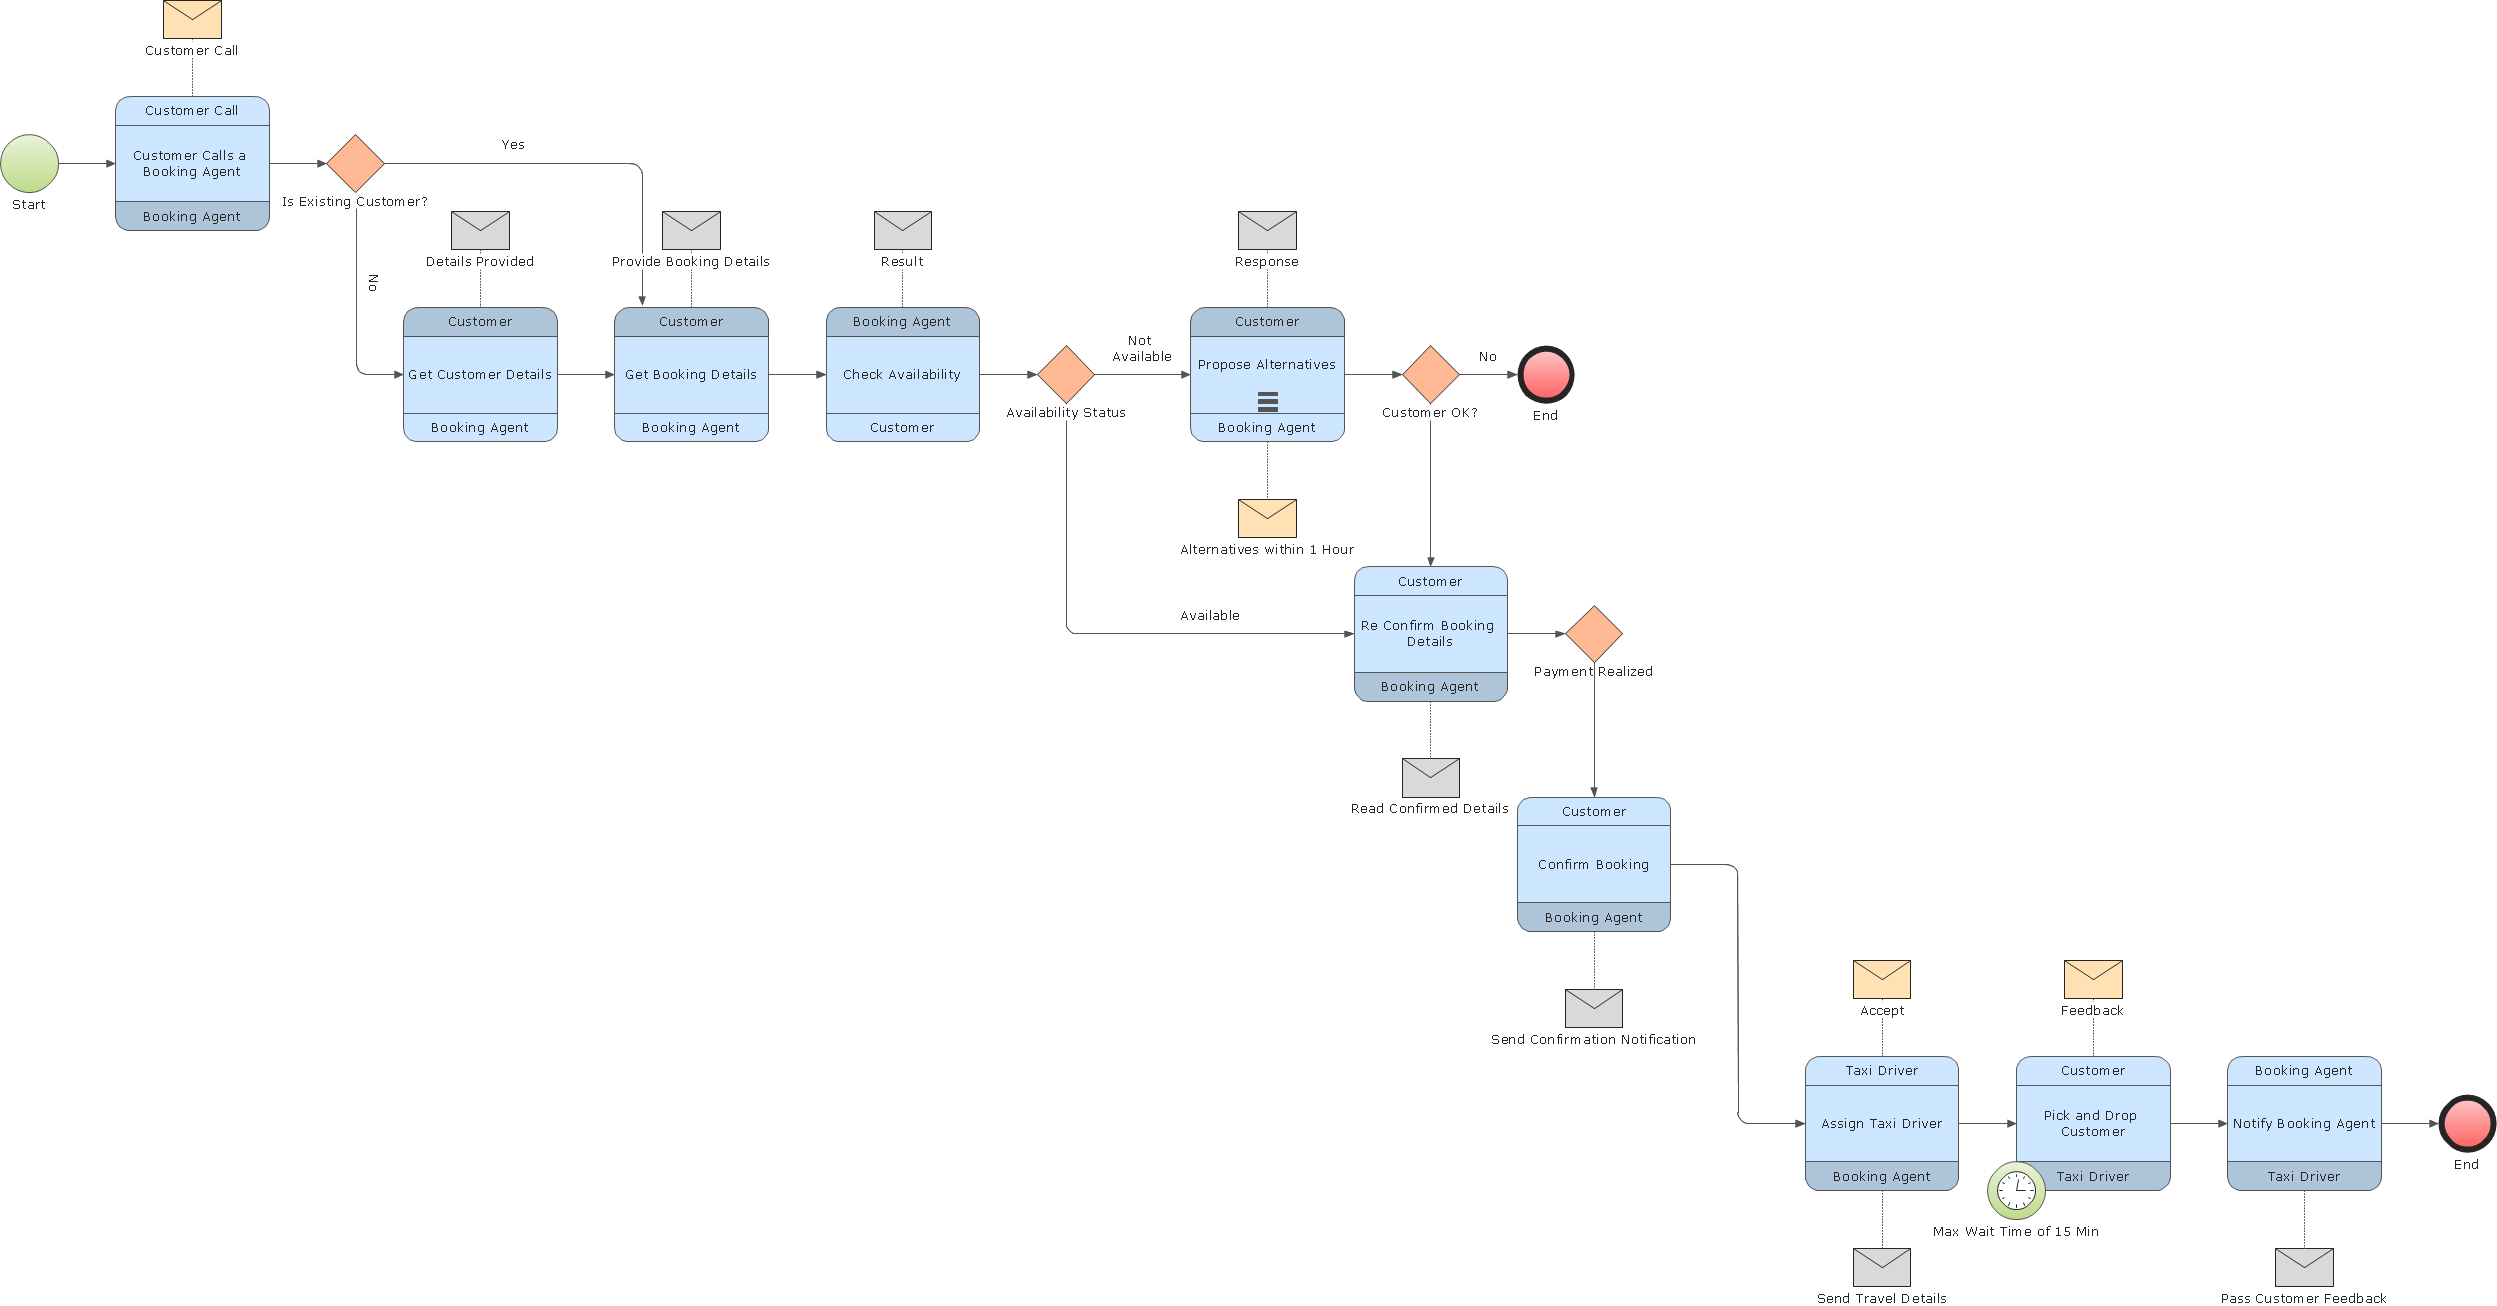
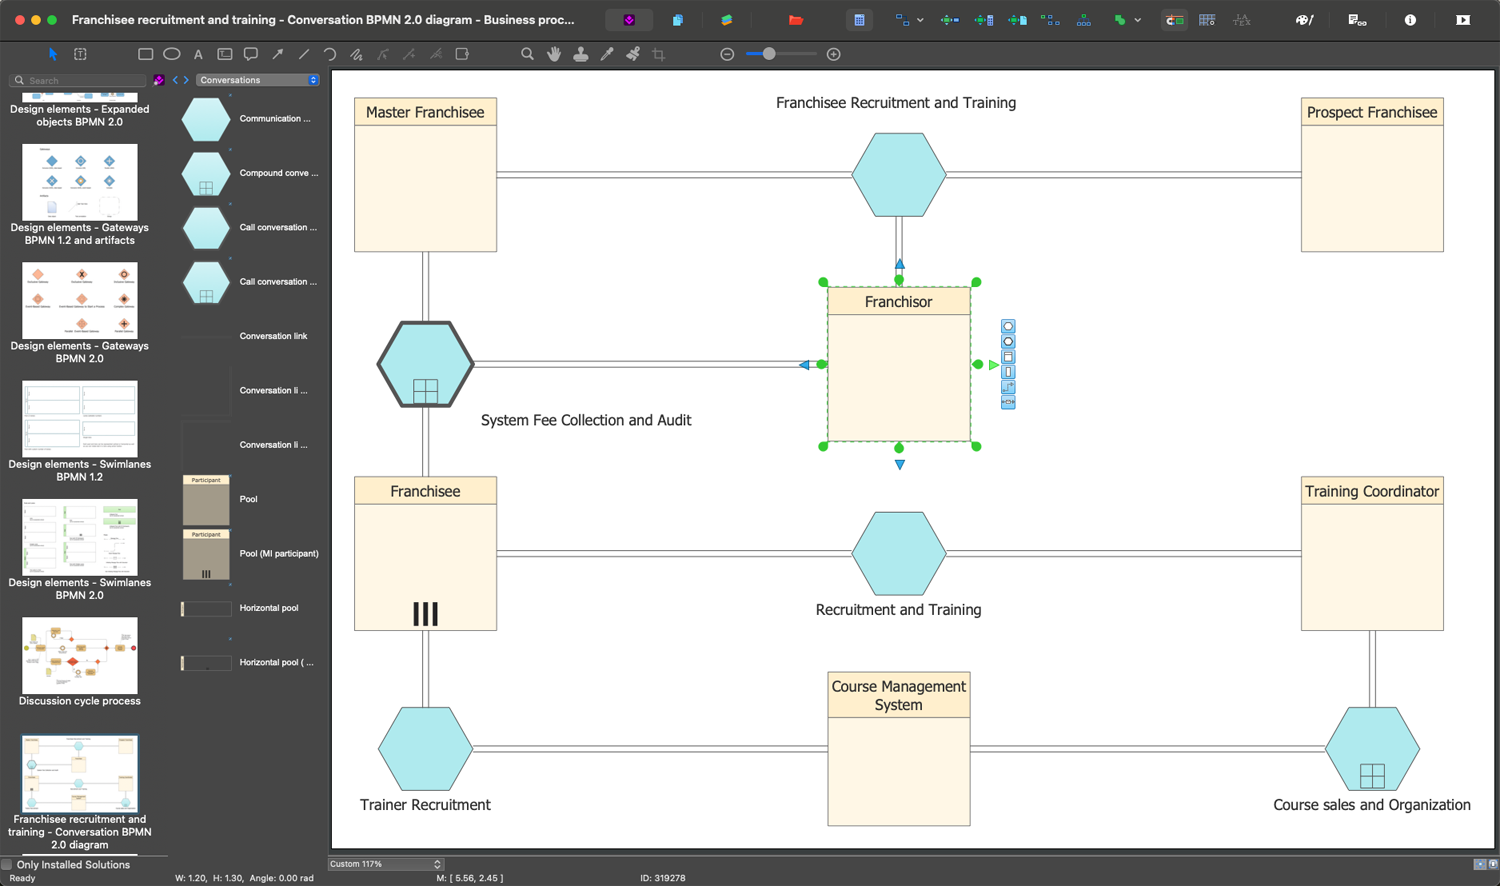
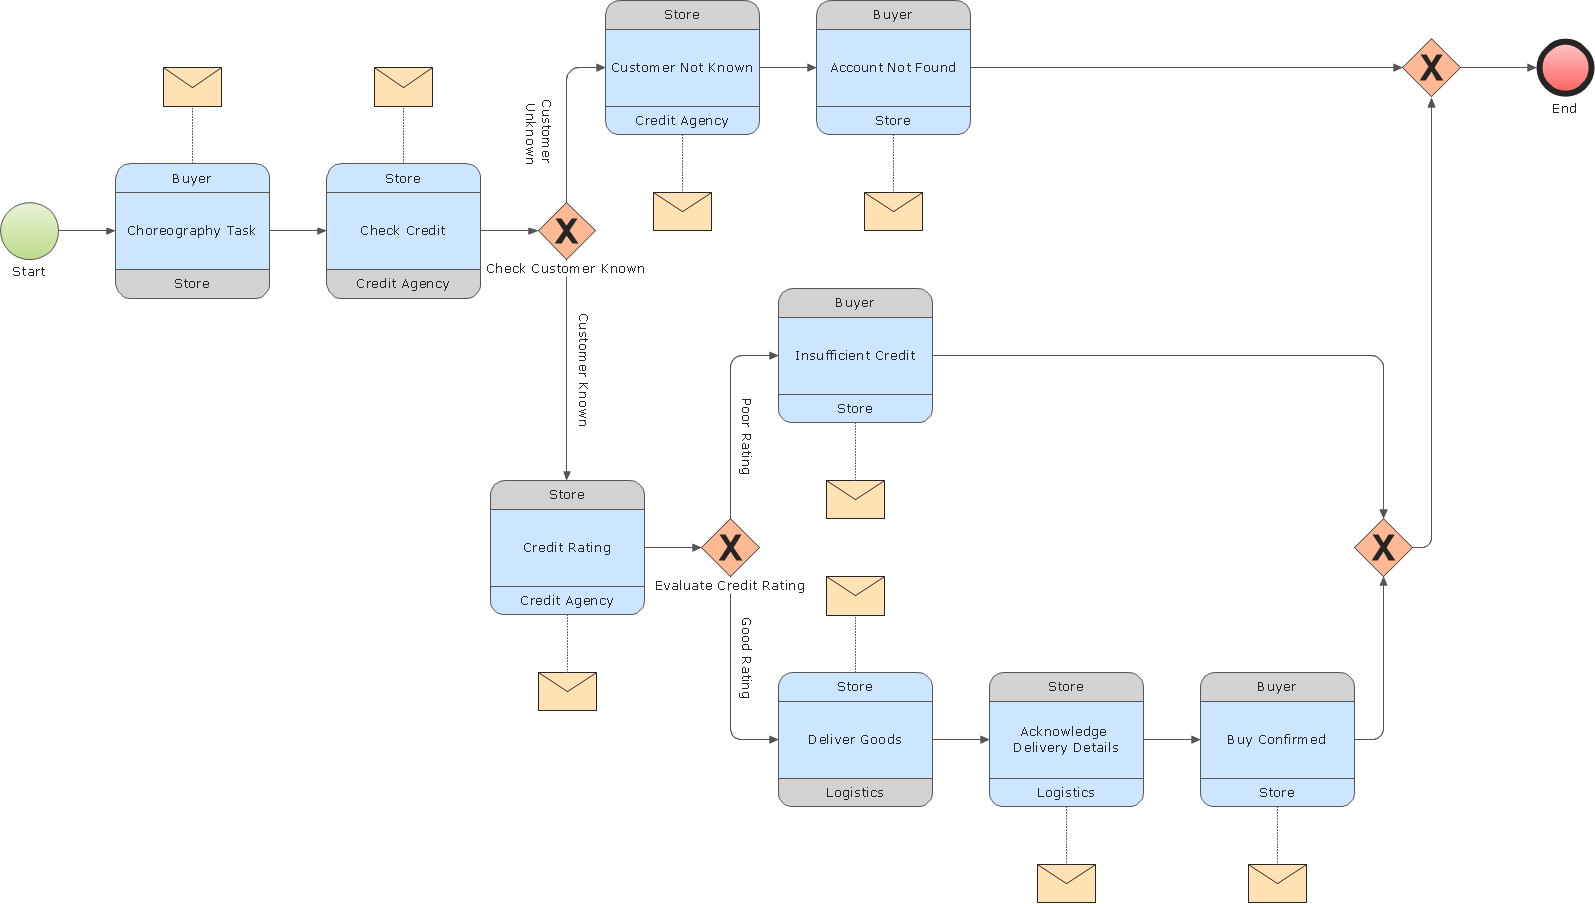
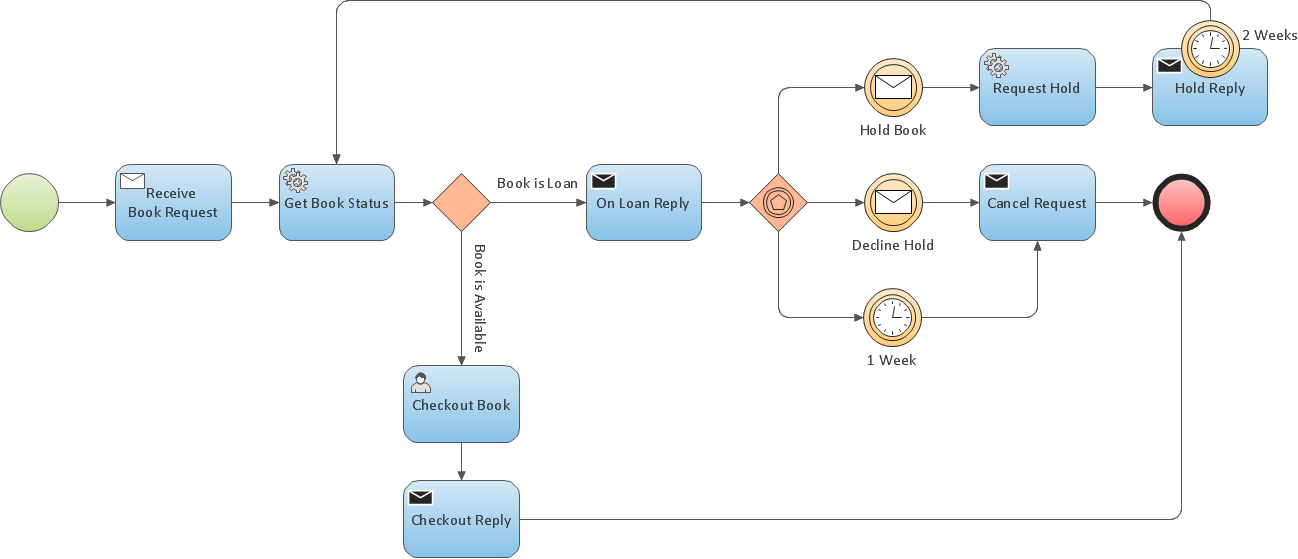
ConceptDraw PRO the best business process modeling tools.contains pre-designed libraries and templates based on the BPMN 2.0 standard that allows to create of both simple and complex (nested) models of processes.The Best Business Process Modeling Software
ConceptDraw PRO is a best business processes modeling software for graphical documenting processes of the company. ConceptDraw has 142 vector stencils in the 8 libraries that helps you to start using Diagramming Software for designing own Business Process Diagrams.
Business Process Modeling Notation Template
Create business process diagrams (BPMN 2.0.) with ConceptDraw using professional looking templates and business process improvement tools.Business Process Modeling
ConceptDraw RapidDraw PRO helps create visually document and communicate Business Process (BPMN 2.0) information.Business Process Modeling Notation
ConceptDraw PRO is a software for simplу depicting the business processes based on BPMN 2.0. Business Process Diagrams Cross-Functional-Flowcharts, Workflows, Process Charts, IDEF0 and IDEF2, Timeline, Calendars, Gantt Charts, Business Process Modeling, Audit and Opportunity Flowcharts and Mind Maps (presentations, meeting agendas).Business Process Management
ConceptDraw RapidDraw technology is a simple point-and-click design that helps create professional, presentation-ready business process diagrams quickly and efficiently.Business Process Modeling Resume
ConceptDraw PRO is a best business processes modeling software for graphical documenting processes of the company.Business Process Modeling Software for Mac
ConceptDraw PRO - business process modeling software for mac offers the Business Process Diagram Solution with powerful tools to help you easy represent the business processes and create the business process diagrams based on BPMN 1.2 and BPMN 2.0 standards that allows to create of both simple and complex (nested) models of processes.Think. Act. Accomplish.
ConceptDraw MINDMAP is ready to provide you with mind mapping tool which can serve as comprehensive productivity tool for your business.
 Fishbone Diagram
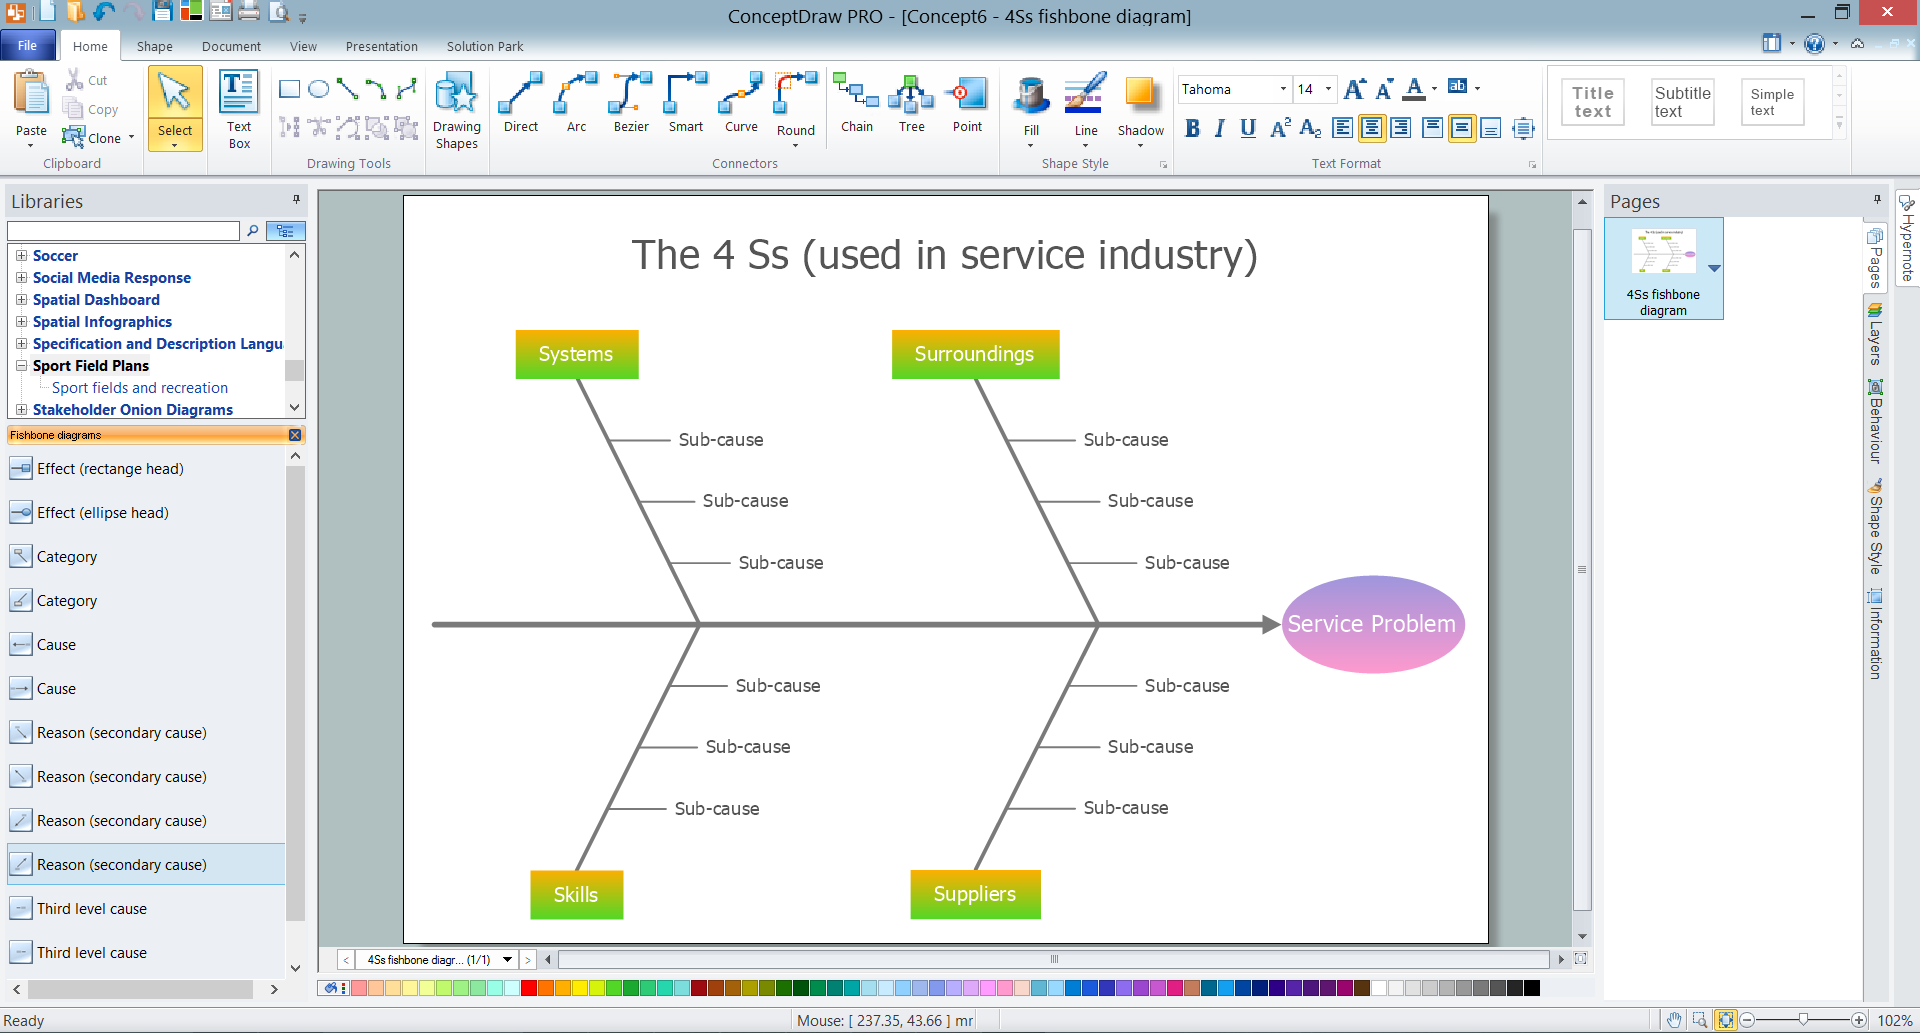
Fishbone Diagrams solution extends ConceptDraw PRO software with templates, samples and library of vector stencils for drawing the Ishikawa diagrams for cause and effect analysis.
Fishbone Problem Solving Tool
Fishbone diagram, often reffered as Cause and Effect diagram or Ishikawa diagram, is one of the basic and the most effective tools for problems solving. It is a way of graphical identifying, structuring and exploration the root causes of a problem for determining effective decision. ConceptDraw PRO enhanced with Fishbone Diagrams solution is a professional fishbone problem solving tool which helps you draw Business Productivity diagram, Cause and Effect, Fishbone, Ishikawa Diagrams to solve problems at your business.- Fishbone Diagrams | Fishbone Diagram | Business Productivity Area ...
- Business Productivity Area | Flowchart Software | Aerospace and ...
- Cause and effect diagram - Increase in productivity | The Best ...
- Illustration | Business Productivity Area | Business and Finance ...
- Business Productivity Area | The Best Business Process Modeling ...
- Business Productivity Area | Management pictograms - Vector ...
- Ansoff Matrix | Matrices | Business Productivity - Marketing | Market ...
- Business Productivity Area | Matrices | SWOT Matrix Template | Fish ...
- Business Productivity Area | The Best Productivity Software | The ...
- Business Productivity Area | Seven Management and Planning ...
- Meter Dashboard | Business Productivity Area | Transport Kpi ...
- Management | Business Productivity Area | Quality Mind Map ...
- Types of Flowchart - Overview | Business Productivity Area | Block ...
- Business Process Modeling Software for Mac | Business Productivity ...
- Seven Management and Planning Tools | Business Productivity ...
- Sales Dashboard | Business Productivity Area | Dashboard ...
- Fishbone Diagram | Project Management Area | Business ...
- Office Layout Plans | Business Productivity Area | CAD Drawing ...
- Why People Select ConceptDraw MINDMAP | Business Productivity ...


