CORRECTIVE ACTIONS PLANNING. Risk Diagram (PDPC)
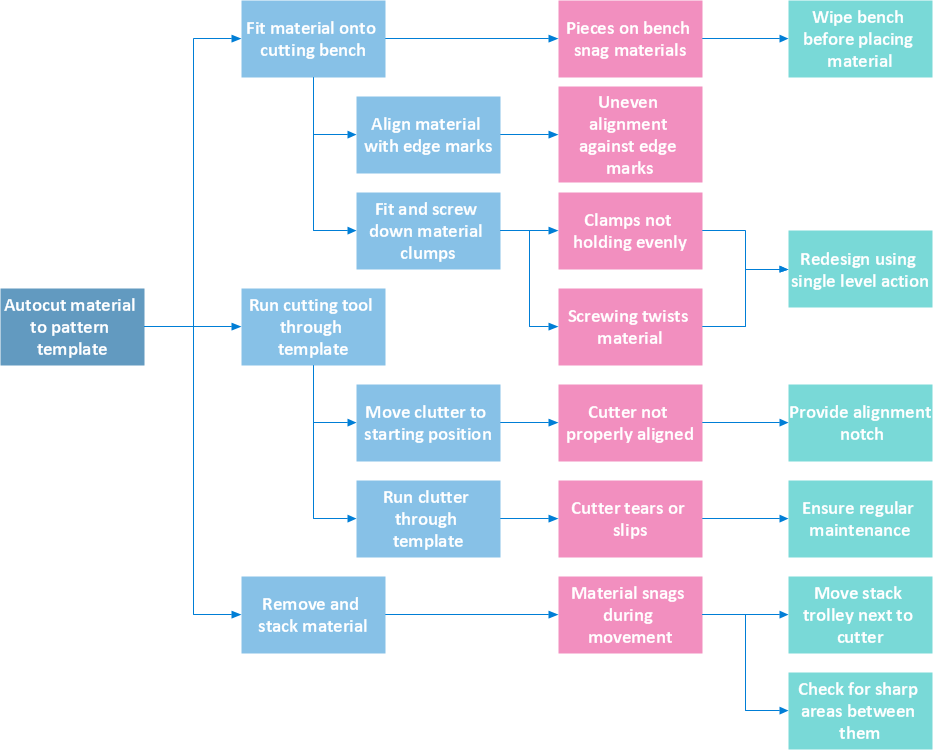
Risk Diagram (PDPC) - ConceptDraw Office suite is a software for Risks Diagram making. This diagram identifies possible risks in accomplishing corrective actions. With the Risks Diagram, one analyzes each action separately in a tree of all actions and develops a preventive action in response of each potential obstacles or circumstances which may be a risk.
Risk Analysis
Risk Analysis. ConceptDraw Office suite is a software for decision making. The Seven Management and Planning Tools is a tool for Risks Diagram drawing. This diagram identifies possible risks in accomplishing corrective actions. With the Risks Diagram, one analyzes each action separately in a tree of all actions and develops a preventive action in response of each potential obstacles or circumstances which may be a risk.
Risk Diagram (Process Decision Program Chart)
Analyze each identified action separately in the tree of all actions and then develop a preventive action in response to potential obstacles or circumstances have been identified as a risk. The PDPC determines the risks when corrective action is not performed correctly. Also, it helps develop descriptions for preventive actions at the level of execution.CORRECTIVE ACTIONS PLANNING. PERT Chart
The PERT Chart is constructed as part of the process in creating a schedule of corrective actions. The PERT Chart shows the logical connections and consequence of tasks to be performed. It displays the time period for problem solving and the implementation of all activities through the critical path. ConceptDraw Office suite is a software for corrective actions planning.
Preventive Action
Preventive Action - ConceptDraw Office suite is a software for the Preventive Action making. The Seven Management and Planning Tools solution is a set of such tools for problems preventive actions via investigating of the core problem. Skilled use of these diagrams makes collaborative teamwork both more engaging and more effective.
The Action Plan
Action Plan - For the action planning define people and groups involvement in corrective actions by roles, identify logical sequences of scheduled actions and critical path of problem solving, identify possible risks of action plan and propose preventive actions. ConceptDraw Office suite is a software for decision making and action plan.
Risk Diagram (Process Decision Program Chart)
The Risk Diagram or Process Decision Program Chart (PDPC) is intended to determine the risks of potential obstacles during the corrective actions that can be at the cases of their incorrect performing, and helps to develop effective preventive actions. Process Decision Program Chart it's kind of contingency plan to limit the risks, it determines the consequential impacts of failures on the activity plans. The Risk Plans and Process Decision Program Charts can be extended on several levels and take the form of tree or hierarchy, this form is incredibly convenient for representing the risks and countermeasures. ConceptDraw MINDMAP is powerful software tool for Business, Marketing and Project Management. It is also ideal for easy designing MINDMAP Risk Diagram or Process Decision Program Chart, due to the included "7 Management and Planning Tools" solution to ConceptDraw Solution Park. We recommend to start with Process Decision Program Chart (PDPC) template opening it from ConceptDraw Solution Browser or from the Output tab at ConceptDraw MINDMAP application.Corrective Action Planning
One of the stages of the problem's solving process scenario is Corrective Action Planning. Corrective action planning define people and groups involvement in corrective actions by roles, identify logical sequences of scheduled actions and critical path of problem solving, identify possible risks of action plan and propose preventive actions.
HelpDesk
How to Manage Problem Solving Using Seven Management and Planning Tools
Stage by stage gouide on using visual tools to move toward solving the problem.
Relationships Analysis
Relationships Analysis. Relations Diagram - factors analysis, factors relations. Create Relations Diagram with ConceptDraw PRO. The Seven Management and Planning Tools is a tool for Interaction diagram drawing. This diagram identifies causal relationships. Determine what factors are causes and which factors are effects. Interaction diagram helps establish KPIs to monitor changes and the effectiveness of corrective actions in resolving the problem.
PROBLEM ANALYSIS. Identify and Structure Factors
Identify and Structure Factors. Use the Affinity Diagram to collect and structure factors that impact on a problem. ConceptDraw Office suite is a software for identify and structure factors with affinity diagram. This is a grouping and structuring of factors that impact on a problem.
Activity Network (PERT) Chart
Activity Network and Project Evaluation and Review Technique, or PERT, charts are a way of documenting and analyzing the tasks in a project. This diagram is constructed as part of the process in creating a schedule of corrective actions. The Activity Network Chart (PERT) shows the logical connections and consequence of tasks to be performed. It displays the time period for problem solving and the implementation of all activities through the critical path.Rainfall Bar Chart
This sample shows the Horizontal Bar Chart of the average monthly rainfalls. This sample was created in ConceptDraw PRO diagramming and vector drawing software using the Bar Graphs Solution from the Graphs and Charts area of ConceptDraw Solution Park.PROBLEM ANALYSIS. Root Cause Analysis Tree Diagram
Root Cause Analysis Tree Diagram. Use the Root Cause Diagram to perform visual root cause analysis. Root Cause Analysis Tree Diagram is constructed separately for each highly prioritized factor. The goal of this is to find the root causes for the factor and list possible corrective action. ConceptDraw Office suite is a software for problem analysis.
- Example Of Image Chart On Business Risk
- Diagram Of Causes Of Business Risk
- Chart On Business Risk
- Sales Growth. Bar Graphs Example | Bar Chart Examples | Bar ...
- Process Flowchart | CORRECTIVE ACTIONS PLANNING. Risk ...
- Flow Chart For Causes Of Business Risk
- Bar Diagrams for Problem Solving. Create business management ...
- Process decision program chart (PDPC) - Personal activity | Risk ...
- Problem Analysis Chart
- Bar Diagrams for Problem Solving. Create business management ...
- Bar Diagrams for Problem Solving. Create business management ...
- Pie Chart For Business Risks
- PERT chart - Sale problem solution | CORRECTIVE ACTIONS ...
- Process Flowchart | Bar Diagrams for Problem Solving. Create ...
- Engineer Solution To A Problem Chart
- Business Plan Problem Identification
- Bar Chart Examples | Sales Growth. Bar Graphs Example | Bar ...
- CORRECTIVE ACTIONS PLANNING. Risk Diagram (PDPC) | Risk ...
- PROBLEM ANALYSIS. Root Cause Analysis Tree Diagram ...
- Corrective Tools On A Business


